Outline
In this Kuehne Impact Series, we introduce the Kühne Center’s vision of environmentally sustainable globalization. Our main point is that buying local is not the same as buying green, because international trade can allow firms and households to source products from greener origins. We therefore advocate embracing international trade in the fight against climate change.
International trade has a terrible reputation when it comes to its effect on the environment. The main reason is that buying local is usually seen as equivalent to buying green, given that ships, trucks, and planes cause transport emissions from burning fuel.
For example, imagine an environmentally conscious consumer from Hamburg who is choosing between a wine from Bordeaux and a wine from Napa Valley. She would probably choose the Bordeaux without much hesitation, given that Germany is closer to France than the United States.
However, this would almost certainly be the worse choice for the environment for two basic reasons:
First, total emissions not only depend on transport emissions but also on production emissions, and there is huge variation in production emissions across countries. According to Nemecek and Poore (2018), viniculture causes around 50% more emissions in France than in the United States, because of the natural advantages of the Californian climate.1 Crucially, production emissions account on average for more than 90% of total emissions in agriculture (including viniculture) so that this should be the main consideration for any green oenophile.
Second, transport emissions not only depend on distance but also the mode of transport, and there is again huge variation in the transport emissions across modes. According to Nemecek and Poore (2018), road transportation causes 20 times more greenhouse gas emissions per ton kilometer than sea transportation (the factor is over 100 for air transportation). And the distance from San Francisco to Hamburg by sea is only about 13 times the distance from Bordeaux to Hamburg by road (approx. 20,000 vs. 1,500 km).
Our Vision
At the Kühne Center, we therefore believe that it is crucial to embrace international trade in the fight against climate change. But what does this mean exactly?
From an economics perspective, the root cause of climate change is that the private costs of emissions are lower than the social costs of emissions so that the market economy is excessively dirty. The textbook response is that carbon should be priced at its social costs, for example through an appropriate carbon tax. Nobel-prize-winning economist William Nordhaus currently estimates the social costs of carbon to be $31 per ton.2
We therefore define environmentally sustainable globalization as the global pattern of trade that would
prevail if carbon were priced at its social costs. While this pattern cannot be observed in the data, it can be approximated with the help of modern quantitative trade models. Kühne Center researchers Marcos Ritel and Dora Simon are in the process of working out such a scenario against which current trade flows and possible policy interventions can then be compared.
We can already say how the composition of actual trade flows differs from the composition of sustainable trade flows along a number of important dimensions. In particular, there currently is (i) too much trade in relatively ‘dirty’ goods, (ii) too much sourcing from relatively ‘dirty’ countries, (iii) and too much reliance on relatively ‘dirty’ transport modes. This is simply because relatively dirty goods, countries, and transport modes are still too cheap relative to the sustainable benchmark, given that carbon is priced below its social costs.
It is crucial to embrace international trade in the fight against climate change.
A First Look At The Data
In the remainder of this Series, we take a first look at the data on world trade, production, and emissions in light of our vision of environmentally sustainable globalization. Our main goal is to illustrate that sustainable globalization can indeed play an important role in fighting climate change.
We present our evidence as five facts. Facts 1–3 document that there is substantial variation in emissions across sectors, countries, and transport modes. Facts 4–5 then show that international trade is currently tilted towards dirtier sectors and countries. Taken together, these facts suggest that buying greener goods, sourcing from greener countries, and using greener transport modes has the potential to greatly reduce trade-embedded emissions.
Trade-embedded emissions account for a substantial share of total emissions so that a significant reduction in trade-embedded emissions would go a long way in fighting climate change. Using OECD data, we estimate that the emissions associated with the production and transport of traded goods account for 30% of CO2 emissions worldwide.
Buying greener goods, sourcing from greener countries, and using greener transport modes has the potential to greatly reduce trade-embedded emissions.
Fact 1 – There is substantial heterogeneity in emissions across sectors
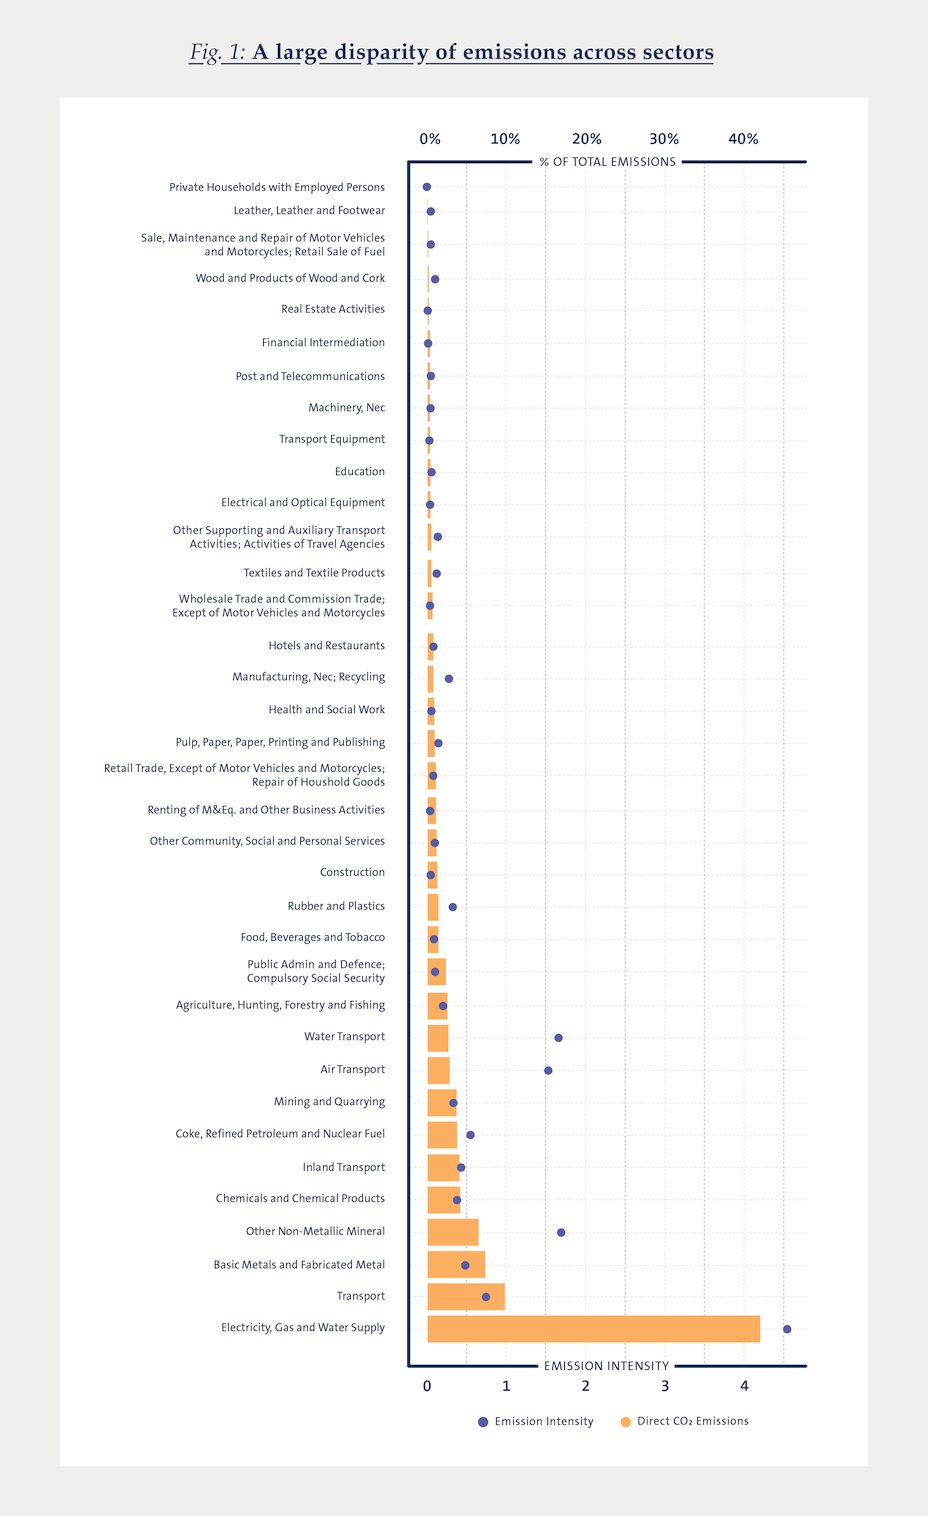
Figure 1 plots the total greenhouse gas emissions caused directly by individual economic sectors (disregarding the emissions from intermediate stages of production). As can be seen, there is substantial variation in greenhouse gas emissions across sectors. For example, production of basic and fabricated metals accounts for 7% of global production emissions, whereas production of leather apparel and footwear represents less than 1%. Note that electricity, gas and water supply is a strong outlier in our data. Direct production emissions of this sector alone make up 42% of global greenhouse gas emissions.3 As one might expect, manufacturing sectors tend to be dirtier than services sectors.
Figure 1 also illustrates emission intensity per sector, that is tons of emissions per dollar of output produced. This variable has the advantage of being independent of the scale of the sector. According to this measure, the ranking of dirty sectors is slightly different but still tilted towards manufacturing goods. Energy, water and gas supply remains the dirtiest sector, followed by transport (in particular water and air transport). Then come a number of manufacturing sectors, in particular the manufacture of minerals, metals, fuels, and chemicals and chemical products.
Fact 2 – There is substantial heterogeneity in emissions across countries
Figure 2 plots the total greenhouse gas emissions caused directly by production activities taking place in individual countries. As can be seen, there is substantial variation in greenhouse gas emissions across countries. Much of this variation can be explained by variation in (i) the scale of production, (ii) the sector composition, and (iii) the energy mix across countries. For example, China is by far the largest emitter in the world, because it produces vast amounts, specializes in some of the dirtiest sectors such as basic and fabricated metals or chemicals and chemical products, and still relies heavily on brown energy sources such as coal.4 As one might expect, countries with a high GDP tend to cause more greenhouse gas emissions than countries with a low GDP.
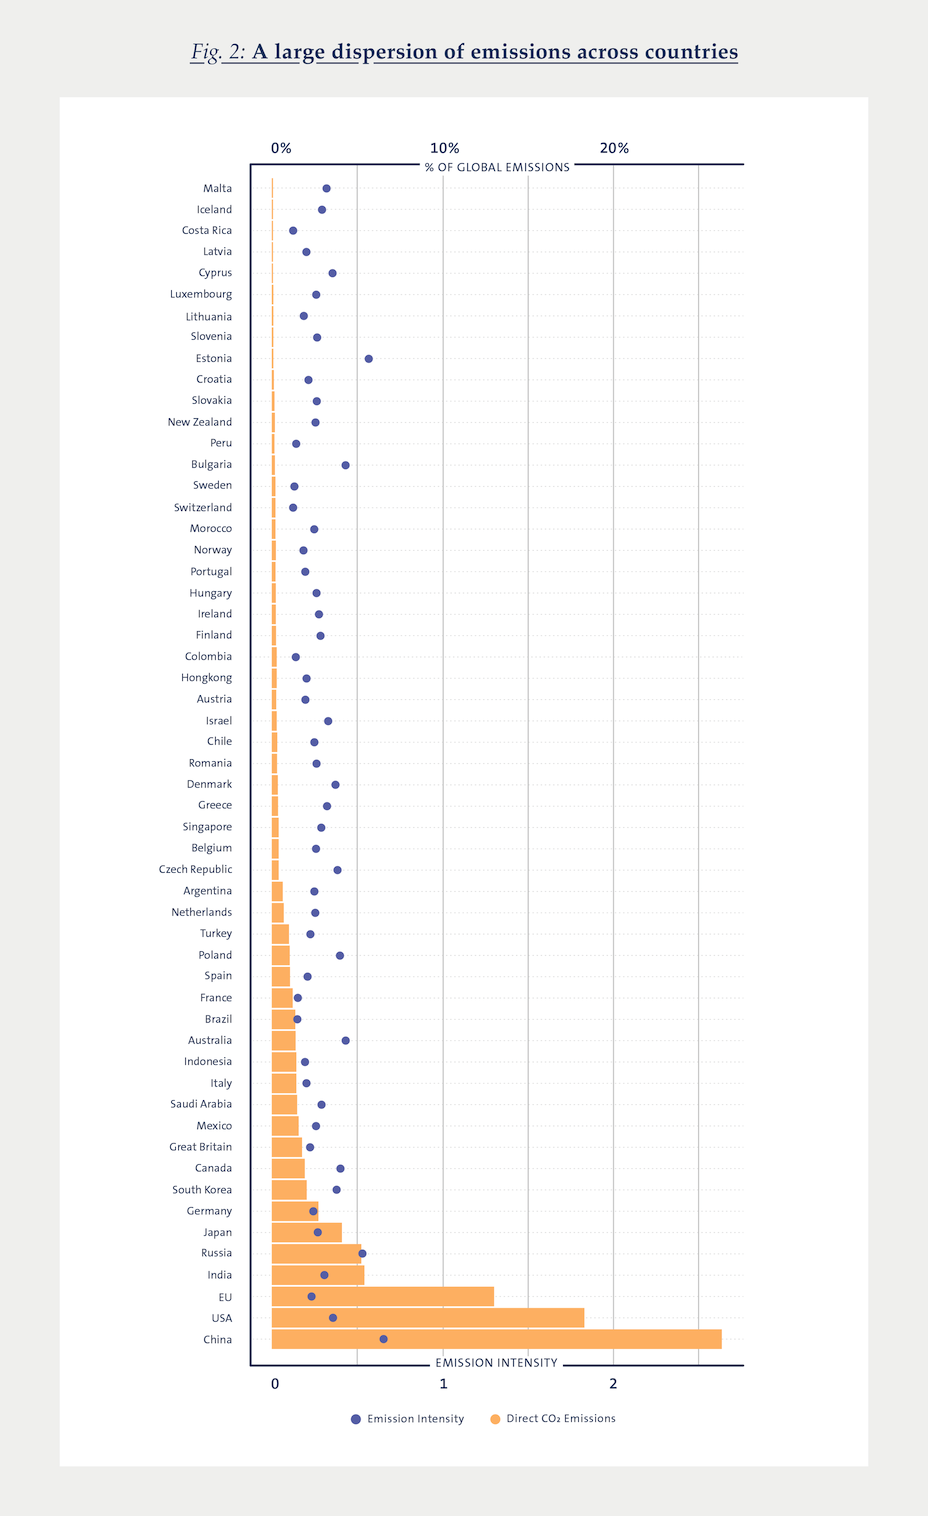
In terms of emission intensity (emissions per dollar of gross domestic product), we see that some of the smaller countries that appeared as low contributors of total emissions (because of their small scale) are in fact quite dirty. While China remains the brownest country, it is closely followed by Central and Eastern European countries (Estonia, Russia, Bulgaria, Poland and the Czech Republic rank among the top-10 more emission intensive countries) and Central and South-East Asian countries (e.g., Korea, India, and Singapore).5 Note that in terms of emission intensity, the EU’s emissions are only about one-third of China’s.
In terms of emission intensity, some of the smaller countries that appeared as low contributors of total emissions are in fact quite dirty.
Fact 3 – There is substantial heterogeneity in emissions across transportation modes
Transportation is one of the dirtiest sectors in the economy, accounting for almost 10% of global direct emissions (and ranking second in Figure 1). Notice, however, that the transportation sector moves goods and people domestically and internationally so that only part of these emissions are related to international trade.
There is substantial heterogeneity across transport modes. In Table 1, we decompose transport emissions into the contributions of inland transport, water transport, and air transport.
Inland transport alone accounts for more than 72% of total emissions produced by the transport sector, followed by air transport (about 18%) and water transport (about 10%). But international trade accounts for only 8% of inland transport, compared to 29% of air transport and 45% of water transport. Overall, David Hummels (Purdue University) and co-authors estimate that international transport accounts for 33% of trade-related emissions worldwide.6
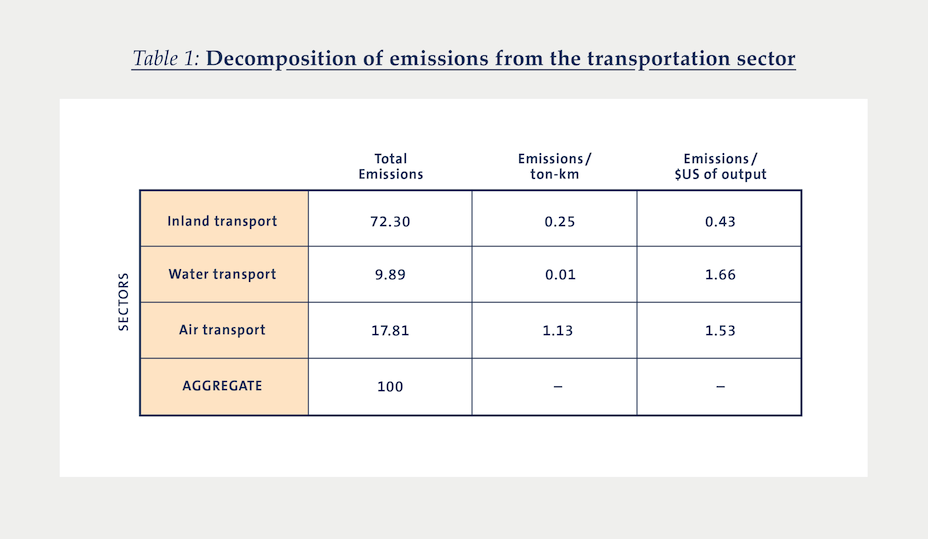
Air transport is the dirtiest transport mode (in terms of CO2 emitted per ton-kilometer), whereas water transport is the cleanest. Even within these groups, there is again large variation: for example, container ships emit about three times more tons of CO2 per ton-kilometer than bulk ships, and cargo fleets are twice as polluting as belly freight on passenger planes. But the way transport modes are priced shifts the per-dollar contribution of each mode. Because air transport is so expensive, its emission rate per dollar of output is slightly lower than water transport, but still higher than inland transport.
Air transport is the dirtiest transport mode in terms of CO₂ emitted per ton-kilometer, whereas water transport is the cleanest.
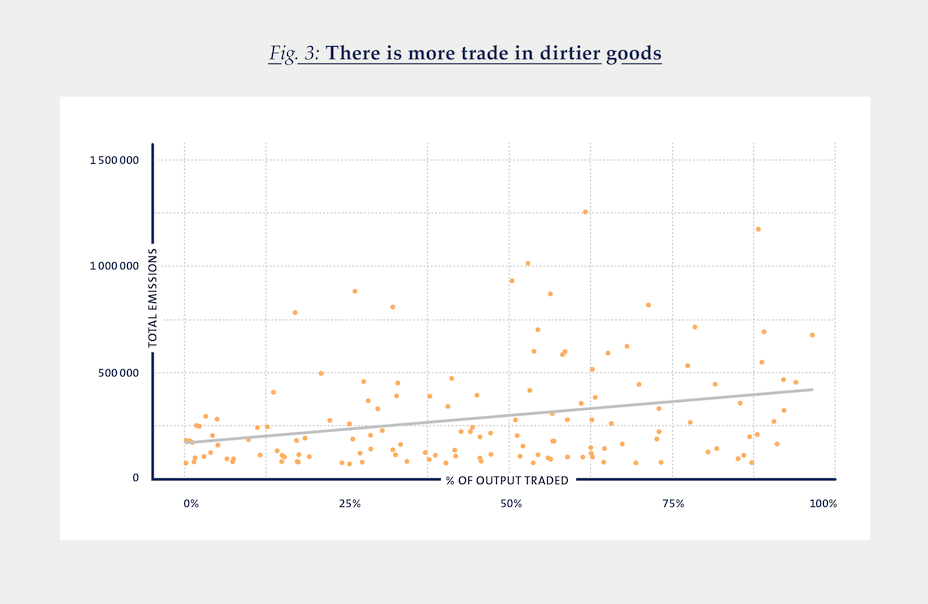
Fact 4 – International trade is tilted towards dirtier goods
Figure 3 shows that dirtier goods tend to be traded more than cleaner goods, where a “good” is a countrysector pair such as Chinese chemicals and chemical products. Notice that a good can therefore be dirty either because it is produced by a high-emissions country, or because it belongs to a high-emissions sector, or both. The variation in trade shares across sectors alone is already remarkable. While 24% of the dirtiest sectors’ output is traded, only 12% of the cleanest sectors’ output is traded. As one would expect, the trade-embedded emissions come mostly from trade in manufacturing goods. All things considered, the manufacture of chemicals and non-metallic mineral products, basic metals and fabricated metal products, and computers, electronic and electrical equipment are the top-3 contributors of trade-embedded emissions.
Interestingly, Joseph Shapiro (University of California – Berkeley) has recently documented that import tariffs and non-tariff barriers tend to be lower for dirtier industries. He estimates that this trade policy bias amounts to an implicit subsidy for dirty sectors of $85 to $120 per ton of CO2 emitted.7 This result is essentially a combination of the observations that upstream industries tend to be dirtier and countries tend to impose lower tariffs on upstream imports.
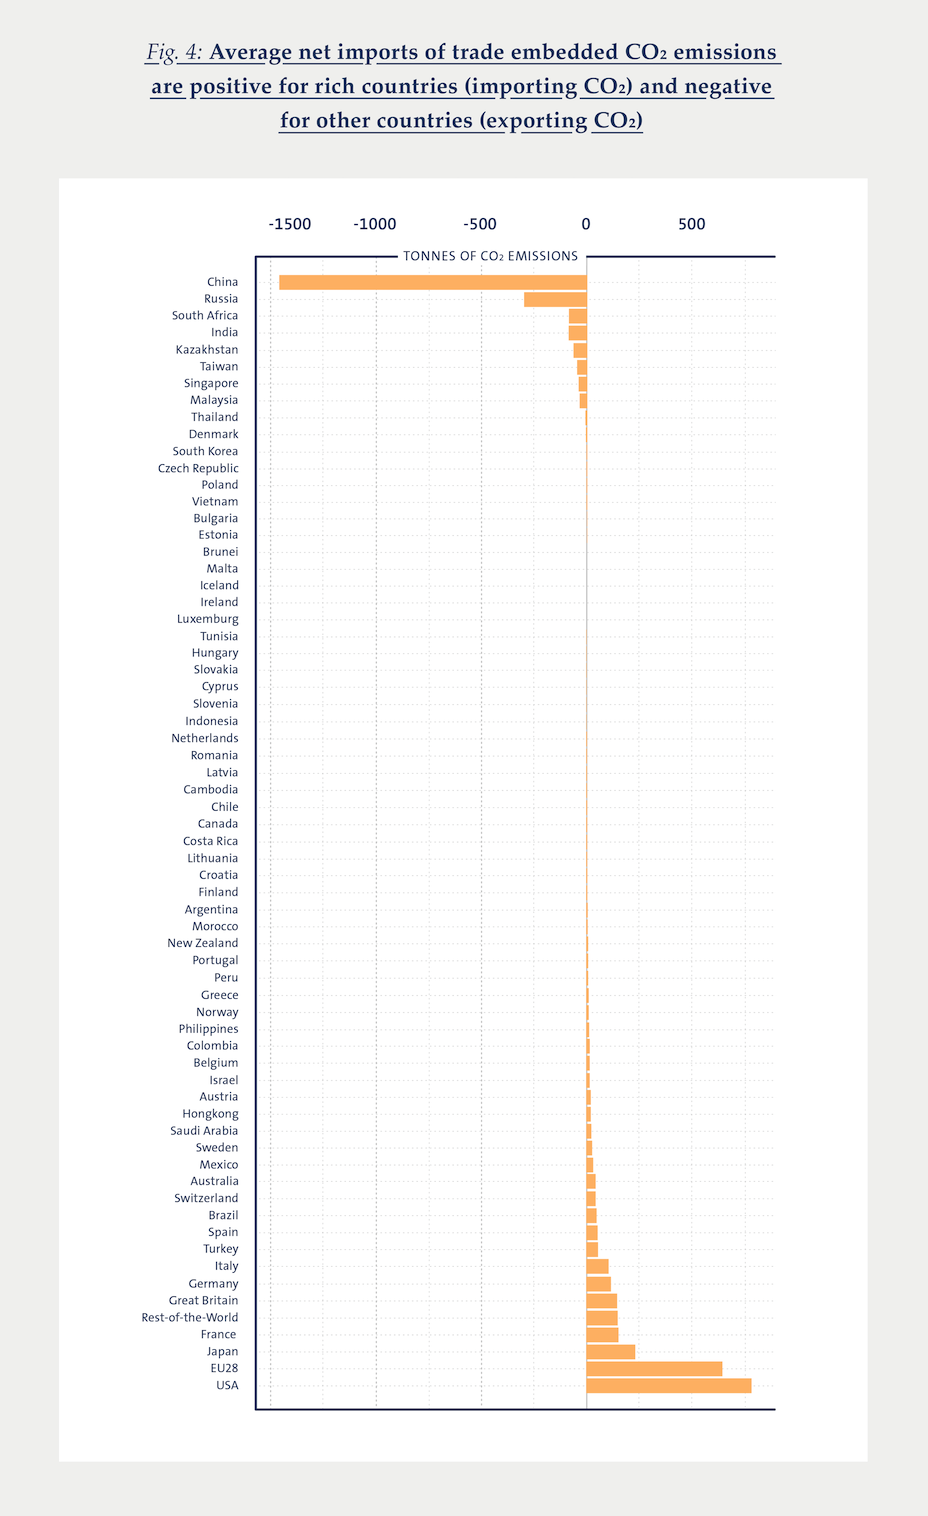
Fact 5 – International trade is tilted towards dirtier countries
Figure 4 plots the CO2 emissions embedded in net imports by country. A positive value means that the imports are dirtier than the exports and vice versa.
In levels, the U.S., Japan, France, the U.K., Germany, and Italy are the largest net importers of CO2 emissions. In 2005, net imports of CO2 by these countries accounted for 6.75% of total production emissions, or a third of the total environmental impact of trade. These emissions are overwhelmingly imported from China (almost five times more than from any other country), Russia, and India, as well as Asian countries (e.g. Singapore, Thailand, Korea, Vietnam), and Central and Eastern European countries (e.g. the Czech Republic, Poland, Bulgaria, or Estonia), which ranked as some of the dirtiest countries in Figure 2 in terms of emission intensity. This pattern also emerges from our analysis of the World Input Output Table, which provides information on the global sourcing choices of each sector in each country.
We illustrate this further with a coarse but instructive thought experiment. We ask by how much global production emissions would decline if countries were sourcing from greener origins, such as the EU, rather than from browner countries, such as China? To this end, we simply replace the emission intensities of Chinese sectors by the corresponding emissions intensities of EU countries and compute the resulting decrease in global production emissions.8 In this hypothetical world, buying green (and not necessarily local) generates a decline of 6.3% of global production emissions.
Conclusion
In this Kühne Impact Series, we have introduced the Kühne Center’s vision of environmentally sustainable globalization. Our main point is that buying local is not the same as buying green, because international trade can allow firms and households to source products from greener origins. We have argued that the composition of trade is distorted away from its ideal. In particular, there is (i) too much trade in relatively ‘dirty’ goods, (ii) too much sourcing from relatively ‘dirty’ countries, and (iii) too much reliance on relatively ‘dirty’ modes of transport.
For us, this Kühne Impact Series is only the first step in a research agenda on sustainable globalization. Climate change is one of the most pressing challenges facing humanity and we believe international trade can play a key role in fighting it. In future work, we aim to substantiate this point and propose new ways of operationalizing it.
- Thomas Nemecek and Joseph Poore (2018): “Reducing food’s environmental impact through producers and consumers”. Science Vol. 360(6392) pp. 987– 992
- William D. Nordhaus (2017): “Revisiting the Social Costs of Carbon”. Proceedings of the National Academy of Sciences of the United States of America.
- Because electricity, gas and water supply is such a strong outlier in our data, which simply comes from the fact that it is the sector involved in producing energy for the rest of our sectors, we will exclude it in most of our subsequent analysis.
- Two things must be mentioned about China: First, China’s territorial emissions only surpassed those of the U.S. in 2006. Second, China is among the countries that have made the largest progress in terms of energy mix in the last decade. The national objective of 25% of total energy use from solar and wind energy was reached in 2019.
- Unfortunately, there are a lot of missing values for Central and South Asian countries which later appear as large net exporters of emissions, such as Vietnam or Thailand.
- A. Cristea and D. Hummels and L. Puzello and M. Avetysian (2013): “Trade and the Greenhouse Gas Emissions from International Freight Transport”. Journal of Environmental Economics and Management Vol. 65 pp. 153 – 173
- Joseph S. Shapiro (forthcoming): “The environmental Bias of Trade Policy”. Quarterly Journal of Economics
- In this exercise, transportation enters the input-output table as an input, but we do not explicitly account for different transportation routes and shorter distances, which would also change transportation modes. In other words, we abstract from the “transportation part” of trade.
Acknowledgements: We thank Jacob Pichelmann and Luca Poll for excellent research assistance.


More Issues
Variable Carbon Pricing and the Environmental Gains from Trade
Optimal Carbon Tax for Maritime Shipping?
The Global Diffusion of Clean Technology

The Sustainable Globalization Index

The Distributional Effects of Carbon Pricing:

The Green Comparative Advantage:

Global Trade

The EU Emissions Trading System
The Hidden Green Sourcing Potential in European Trade

The European Green Deal

Post-COVID19 resilience

Africa’s Trade Potential

A New Hope for the WTO?

Crumbling Economy, Booming Trade
Pandemic and Trade
The Dynamics of Global Trade in Times of Corona

EU Trade Agreements
Past, present, and future developments