
Outline
Talks of “deglobalization” or “slowbalization” have multiplied in the aftermath of the Great Trade Collapse of 2008/2009. The recent economic shock of the COVID-19 pandemic and the war in Ukraine have re-ignited fears of global value chain disruptions, and lead many in international trade to claim the end of globalization as we know it. In this Kühne Impact Series we examine these facts and find that while few statistics point towards a slowdown in global trade, looking at the broad picture we can still be cautiously optimistic. More concerns arise, instead, when looking at the policy landscape.
Broad Trends: Is “deglobalization” visible in the data?
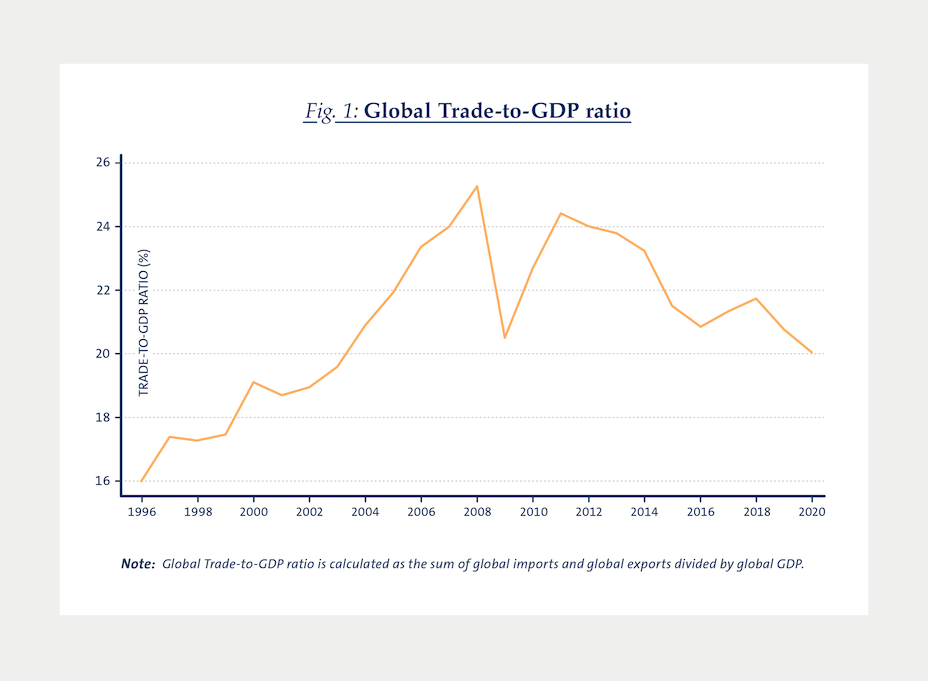
Claims of deglobalization are largely substantiated by the evolution of the global Trade-to-GDP ratio after 2009 (Figure 1). The Trade-to-GDP ratio is one of the most common indicators for trade openness, or for the “volume” of trade. It expresses the relative importance of international trade (the value of imports and exports) in the overall economy (measured by the GDP).
From the mid-1990s until 2008, global trade was characterized by a steady increase of the Trade-to-GDP ratio (from 16% in 1996 to 25% in 2008). The Great Recession of 2008/2009 clearly interrupted this trend, with a decline of the ratio of 5 percentage points within a year. Despite a significant recovery in 2010, the evolution of this ratio in the aftermath of the recession is characterized by a steady decline. In 2019 (just before the COVID-19 pandemic), global trade represents 21% of global GDP, lower than what had been attained in 2004.
As the Great Recession has mainly affected developed economies, one could wonder whether this deglobalization trend affects every country the same way. In Figure 2 we present the evolution over the same period of the Trade-to-GDP ratio of the five largest economies in the world: China, the EU (with and without intra-EU trade), India, Japan, and the US. Three facts clearly emerge from this picture. First, the Great Recession affected the Trade-to-GDP ratio of all the considered economies, including China and India, who were presumably less connected to the global financial system: due to globalization, countries are much more interconnected and economic shocks spread quickly across borders. Second, all selected countries with the exception of the EU show signs of a similar deglobalization or at least slowbalization: the Trade-to-GDP ratio of China, India, and the US clearly follows a downward sloping trend after 2010, Japan’s ratio remains flat, and the Trade-to-GDP ratio of the EU is increasing when including intra-EU trade but flat otherwise. Third and finally, China’s Trade-to-GDP ratio started decreasing before the 2008/2009 economic crisis, and collapsed even further during the Great Recession, despite a mild recovery in 2010. While China’s trade represented more than 60% of its GDP in 2006, this ratio falls to 28.5% in 2020. Part of this trend can be explained by China’s explicit effort to reduce its openness to the world and to encourage domestic consumption (in particular in the 11th and 12th Five-Year Plans). A quick check shows that this however doesn’t drive the global aggregate trend, as the evolution of Trade-to-GDP globally remains identical when excluding China.
As a conclusion, with Trade-to-GDP ratio as the sole statistics to describe globalization trends, it appears that indeed, the Great Recession marked the end of an era, and some evidence for a beginning deglobalization in terms of “volumes”. Other statistics however provide a different picture that mitigates this message. In fact, while Trade-to-GDP ratios provide information on the “volume” of globalization, other statistics can provide information on its “shape” and “outreach”, respectively, global value chain (GVC) participation indices, and the importance of distance in bilateral trade relationships.
The Great Recession marked the end of an era, and some evidence for a beginning deglobalization in terms of “volumes”.
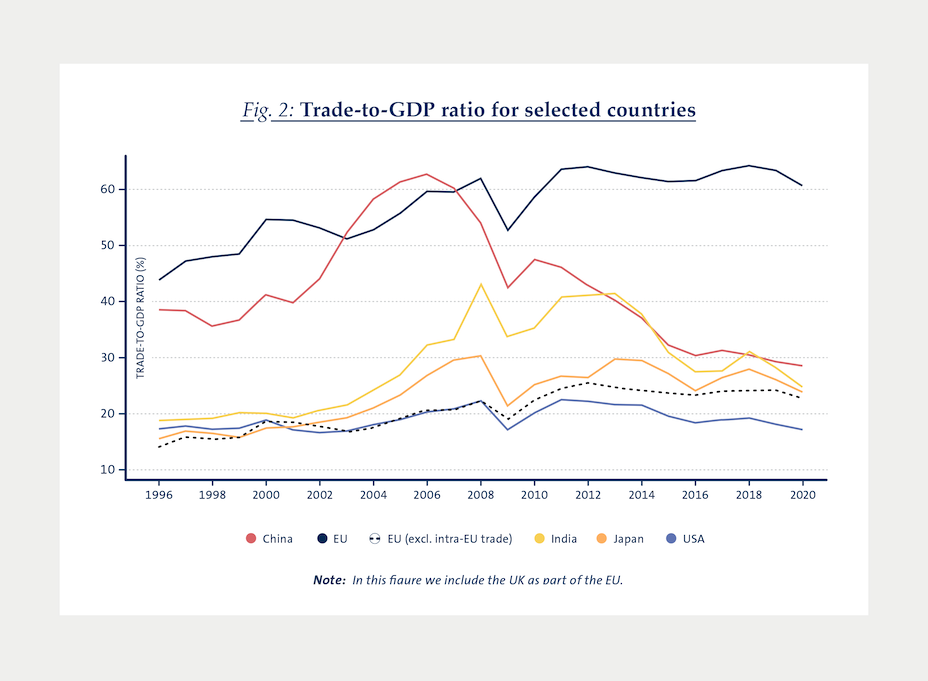
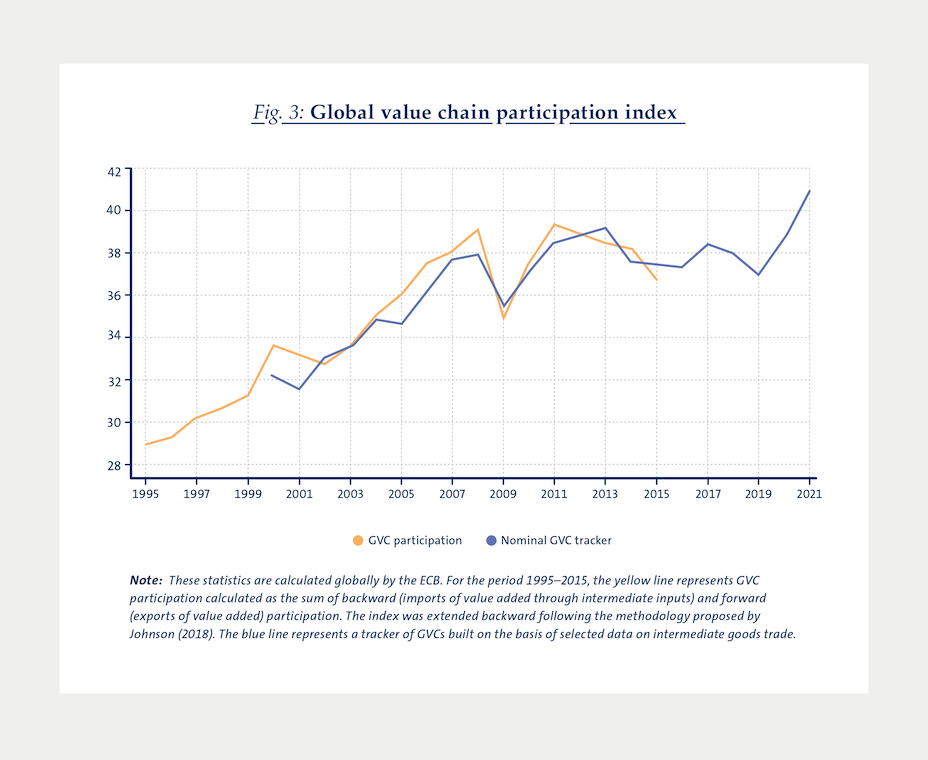
Figure 3 presents evidence on GVC participation. Indicators of GVC participation track countries’ engagement in GVCs and serve as proxies for the fragmentation of the production process, and are good indicators for the “shape” of trade. GVC participation is generally computed as the share of GVC-related trade (trade flows of value added that cross at least two national borders – following Borin and Mancini1) over gross exports. For example, a smartphone assembled in China might include design elements from the United States, high-tech components from Japan, silicone chips from Singapore, metals from Bolivia. Throughout this process, all countries involved retain some value and benefit from the export of the final product.
Focusing on the yellow line, GVC participation is characterized like the Trade-to-GDP ratio by a sharp decline during the Great Recession, a strong recovery in 2010/2011, and a mild declining trend afterwards. The blue line extends this trend using data on intermediate inputs trade. In the medium run, GVC participation between 2015 and 2020 appears steady at 38% of gross exports, suggesting that integration of production processes recovered from the Great Recession but did not accelerate any further – as was the case prior to 2009. The flat trend sustains the view that there is no disproportionate undoing of GVCs despite a decline in “volumes”. This could potentially substantiate a claim for slowbalization but not necessarily for deglobalization in terms of “shape”, and it could contribute to a decline in world trade growth and to lower trade elasticity in the future.
If the “volume” of globalization has declined, but its “shape” appears unchanged, this begs the question of whether the network – and more specifically the “outreach” of bilateral trade relationships – has changed substantially after 2009. In order to study this, we propose a third statistics to explore globalization over time: the distance coefficient in a gravity equation. Recall that the gravity equation links bilateral trade volumes Xod between origin o and destination d to the (economic) size of the respective trading partners, distance, ethnical, historical and institutional links between countries (such as language, colonial dependence, or legal heritage) and trade agreements. Conditional on all other factors, the distance coefficient represents in any given year how an increase of distance between two countries by 1% affects the volume of trade between them. Traditionally it has been estimated to be around –1% (Head and Mayer 2), that is, a 1% increase in distance between two countries decreases their bilateral trade volume by 1%. Considered over time, it informs us of how “long-distance” trade is, and whether this distance has increased or decreased over time. We consider three distinct samples of analysis: trade between the 10 largest economies in 2020 (in terms of current GDP, Figure 4 a), between the 50 largest (Figure 4 b), and between the 100 largest (Figure 4 c).
Several facts emerge from the comparison of the three figures. First, the scale of the distance coefficient reveals that distance has very little impact on bilateral trade for the richest economies, but more so when relatively smaller economies are considered: on average the distance coefficient is around –0.4 for the ten largest economies, –0.8 for the 50 largest, and –1 when we extend the sample to the 100 largest economies. Second, the effect of the Great Recession on the elasticity of trade volumes to distance is somewhat lagged, as we see the sharpest declines in three out of four figures between 2010 and 2011 (note that there is a relatively smaller effect of the Great Recession on the distance coefficient when a larger sample is considered). This is not necessarily surprising, as trade relationships may take time to adjust both on the intensive and on the extensive margin.
Distance has very little impact on bilateral trade for the richest economies, but more so when relatively smaller economies are considered.
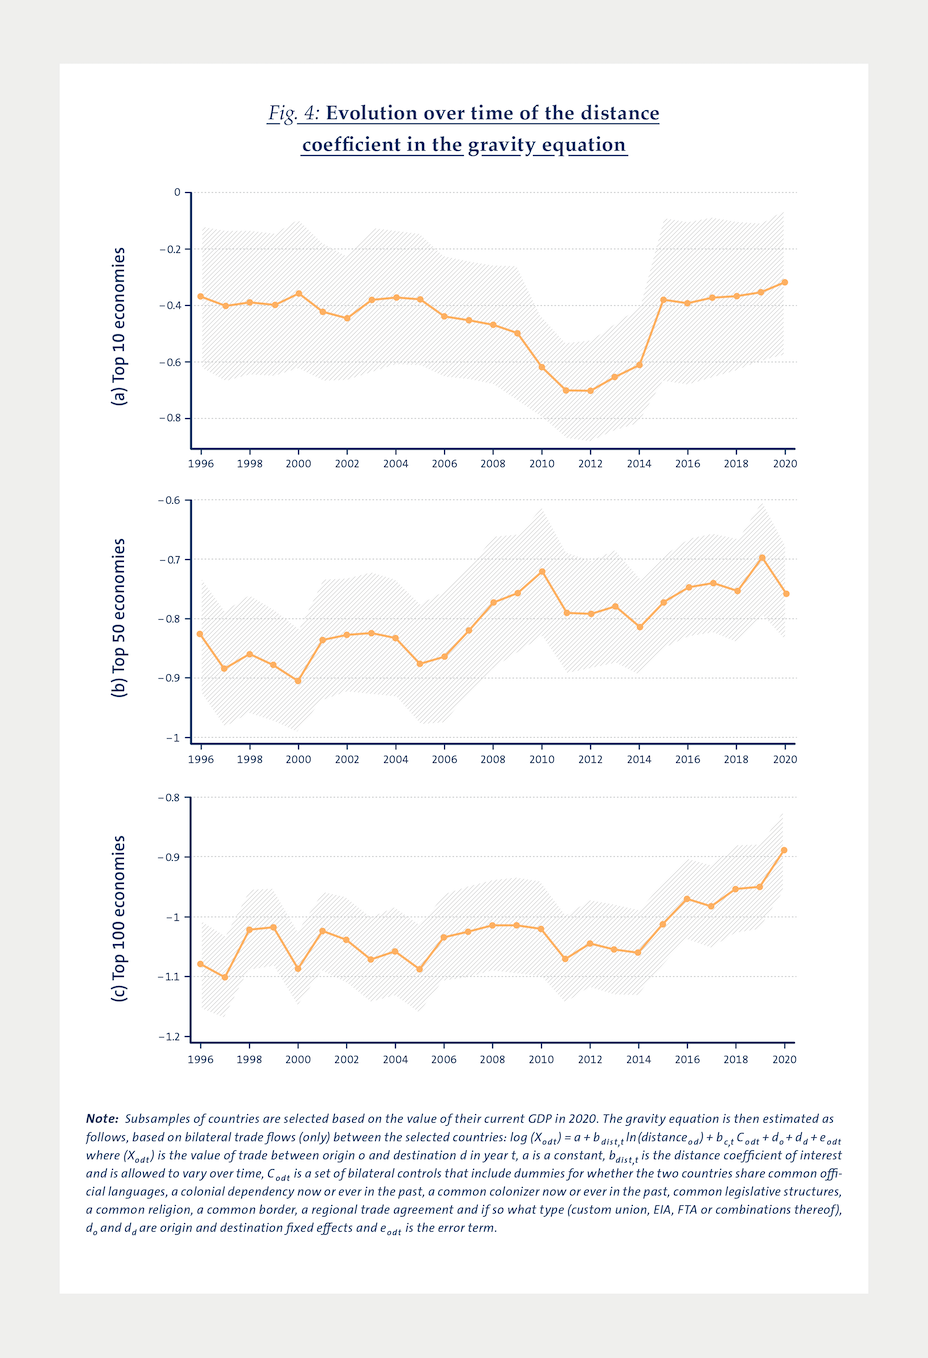
Third, the evolution of how “long-distance” trade is differs a lot depending on the set of countries one studies. Not only does trade between the 10 largest economies barely respond to distance, but this elasticity hasn’t changed at all during the period 1996–2020 except during the Great Recession.3 There is a little and significant uptick of the coefficient in 2001/2002 that can be explained by the entry of China in the WTO, followed by a small downward trend after 2005, but overall, the pre-2009 trend is flat. When introducing the next 40 largest economies in the sample, the elasticity of trade to distance increases (in absolute value) and its time-trend changes. There is a significant decrease in the (absolute) value of the distance coefficient between 1996 (–0.83) and 2010 (–0.72), suggesting that as globalization intensifies, distance becomes less and less of a hurdle to trade. As for other statistics, the Great Recession (or slightly after) marks a structural break, and the coefficient remains relatively flat afterwards around –0.75 (based on the 95% confidence interval, the coefficients between 2009 and 2020 are not significantly different from each other). A different pattern emerges when considering the 100 largest economies: the effect of distance on bilateral trade volumes remains relatively constant until 2014 (with a small but significant break in 2010/2011) around –1.05, and exhibits a significant and steep increase afterwards. In 2020, a 1% increase in distance between two of the 100 largest economies led to a reduction of bilateral trade volumes of “only” 0.88%. This implies that as we introduce smaller countries in our sample, with smaller bilateral exchanges, the “outreach” of globalization changes, and so should our interpretation of whether there is a deglobalization or not.
Taken together, all three pictures point towards an increase in world trade integration, also in the most recent decade, with no particular sign of deglobalization or slowbalization in terms of “outreach”. Combined with the other statistics we presented, we observe at best a stabilization of trade integration, which need not be in contradiction with a declining Trade-to-GDP ratio.
Taken together, all three pictures point towards an increase in world trade integration, also in the most recent decade, with no particular sign of deglobalization or slowbalization in terms of “outreach”.
Potential Drivers: Is there a substantial change of paradigm?
To further explore whether the Great Recession marks the peak equilibrium of globalization or truly a tipping point leading to a slow but sure decline, we consider what could be the driving forces behind a change of paradigm. Amongst the possible candidates, we explore in turn labor costs, the increasing role of trade in services relative to trade in goods, and the role of geopolitical uncertainty and fear of GVCs disruption in a trade “regionalization”.
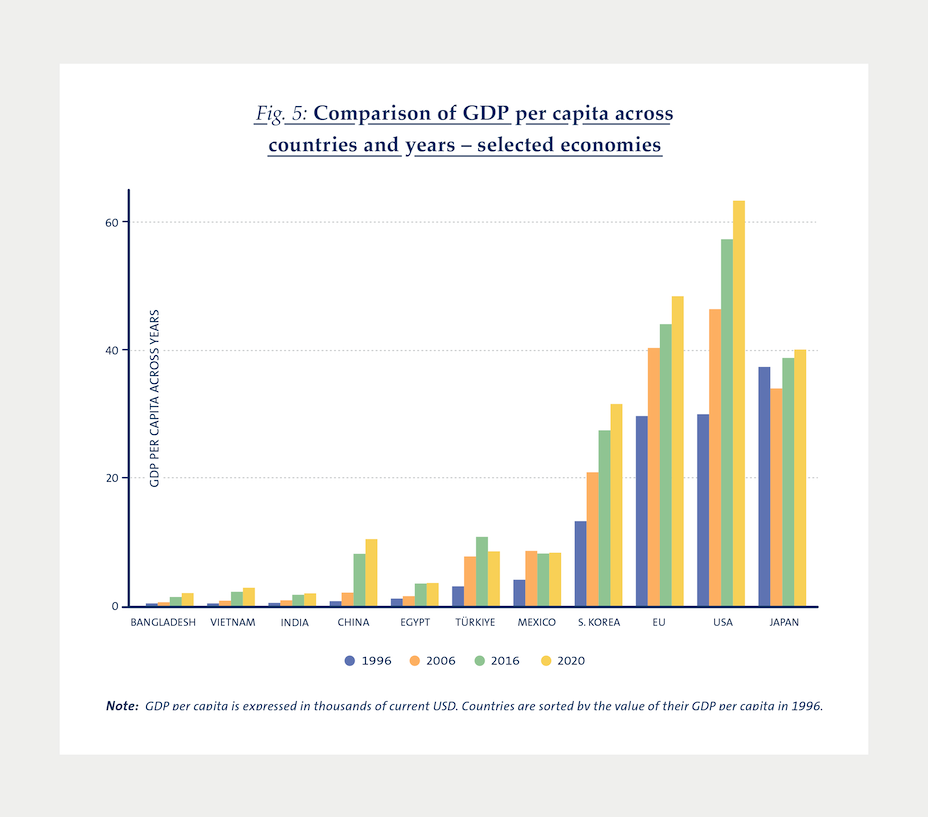
One of the main possible driving forces for changes in the shape of global value chains in the recent period is the evolution of the cost of labor across countries. In particular, it is sometimes argued – by advocates of “reshoring” in particular – that the cost of labor in Asian economies has steadily increased over the past two decades, rendering the use of offshored facilities less attractive, as Chinese salaries level with American ones. This would in turn fuel a deglobalization trend. Figure 5 shows that this isn’t exactly true. Chinese GDP per capita has been multiplied by 15 between 1996 and 2020, an increase that isn’t observed for many other countries. However, GDP per capita in China in 2020 is $10,500, whereas the US GDP per capita is $64,000 and German GDP per capita is $46,000. So the idea that the cost of labor in China is now similar to the cost of labor in some of its largest trade partners does not hold in the data. The comparison with other low-income economies however suggest that there may be some ground for “friend-shoring”, that is the relocation of offshored facilities closer to home in “friend” countries with lower labor costs. For the US for example, a natural candidate is Mexico, whose GDP per capita in 2020 was $8,000, so indeed lower than China’s approximate cost of labor. For the EU, one can consider for example Türkiye, whose GDP per capita in 2020 was $8,500, as a substitute for China’s textile industry.
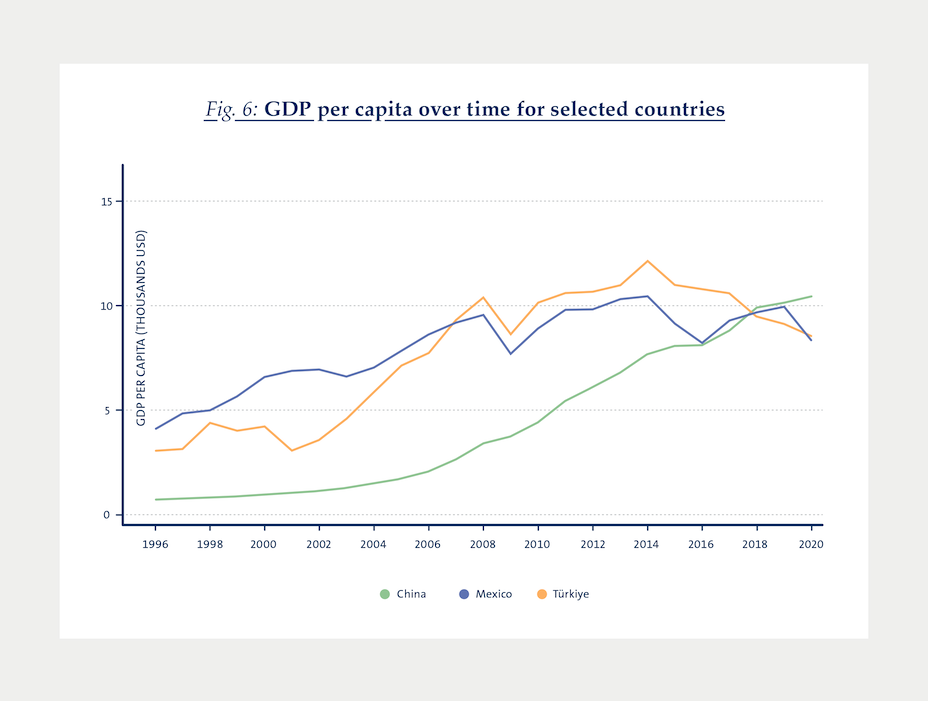
Figure 6 however shows that this reversal of labor cost rankings is very recent: in our example, China’s GDP per capita became higher than Mexico’s or Türkiye’s first in 2017. In 2017, China still ranked 37 out of 50 in terms of GDP per capita, and only reached rank 31 in 2020. As a result, labor costs considerations are unlikely to have driven any of the observed aggregated trends, and overall are more likely to promote friend-shoring rather than reshoring.
Labor costs considerations are unlikely to have driven any of the observed aggregated trends, and overall are more likely to promote friend-shoring rather than reshoring.
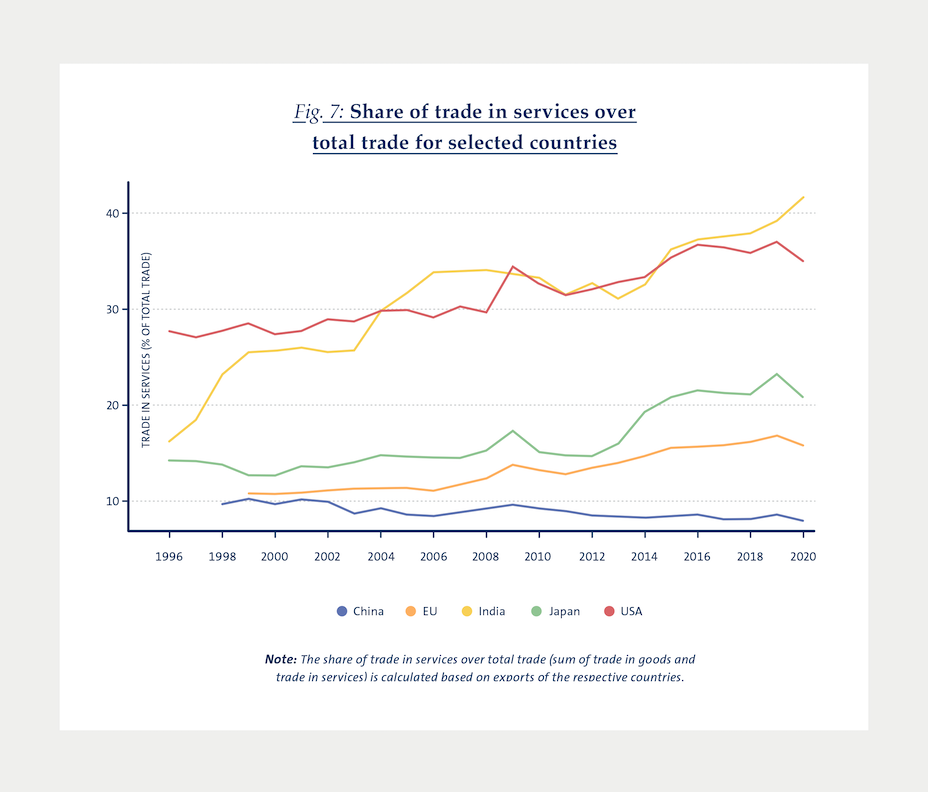
Another potential force at play in the perceived change of international trade paradigm is the rising importance of trade in services, which became particularly salient during the COVID-19 pandemic. Most statistics about globalization refer to or are driven by trade in goods. However, if services represent an increasing share of economic activity and by transitivity of trade flows, the deglobalization or slowbalization may only reflect the decline of trade in goods relative to trade in services, rather than a decline of international trade altogether. Figure 7 illustrates the increasing share of trade in services in total trade for a selected group of countries: China, the EU (incl. intra-EU trade), India, Japan and the US.
There’s a clear increasing trend for all countries except China, and the magnitudes we find are significant: in 2020, 35% of US trade was trade in services, and 16% of EU trade. The graph shows that the Great Recession also had a short but significant impact on the share of trade in services for the US, Europe and Japan, and a large impact in 2020 at the onset of the COVID-19 pandemic. This pattern of response to shocks suggests that while trade in services may partially explain the decline in Trade-to-GDP ratio, it cannot be used to explain a “tipping point” after the Great Recession.
The multiplication of trade crises in the recent decades (Great Recession, Brexit, COVID-19, Ukraine war) has shed light on the fragility of global value chains and exacerbated the need to ensure the resilience of trade networks. This has fueled discussions on reshoring and friend-shoring, namely the repatriation of GVCs domestically or within spheres of geopolitical influence. Using our statistics on GVC participation we can provide some factual evidence on that debate.
The multiplication of trade crises in the recent decades has shed light on the fragility of global value chains and exacerbated the need to ensure the resilience of trade networks.
Regionalization is no new concept. Figure 8 illustrates the strong reliance upon intra-regional trade for most geographic areas over time. In that regard, Europe does not appear as an outlier favored by its customs union: while the European share of intraregional trade remains stable around 70% between 1995 and 2021, this share is at 50% for the Americas. An interesting dynamic can be observed for Asia: the share of intra-regional trade increases from 50 to 60% between 1998 and 2021. From this picture it appears that any regionalization trend would have started long before the Great Recession. Africa is a clear outlier in this picture, with a share of intra-regional trend averaging at 15%. It is the only region for which a “regionalization” effect seems to have picked up after 2008.
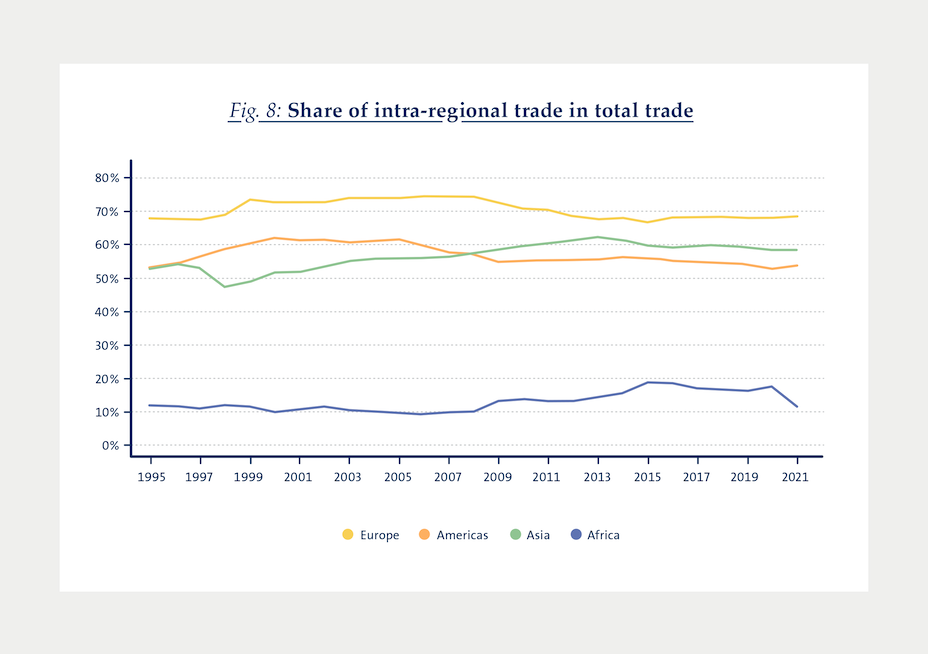
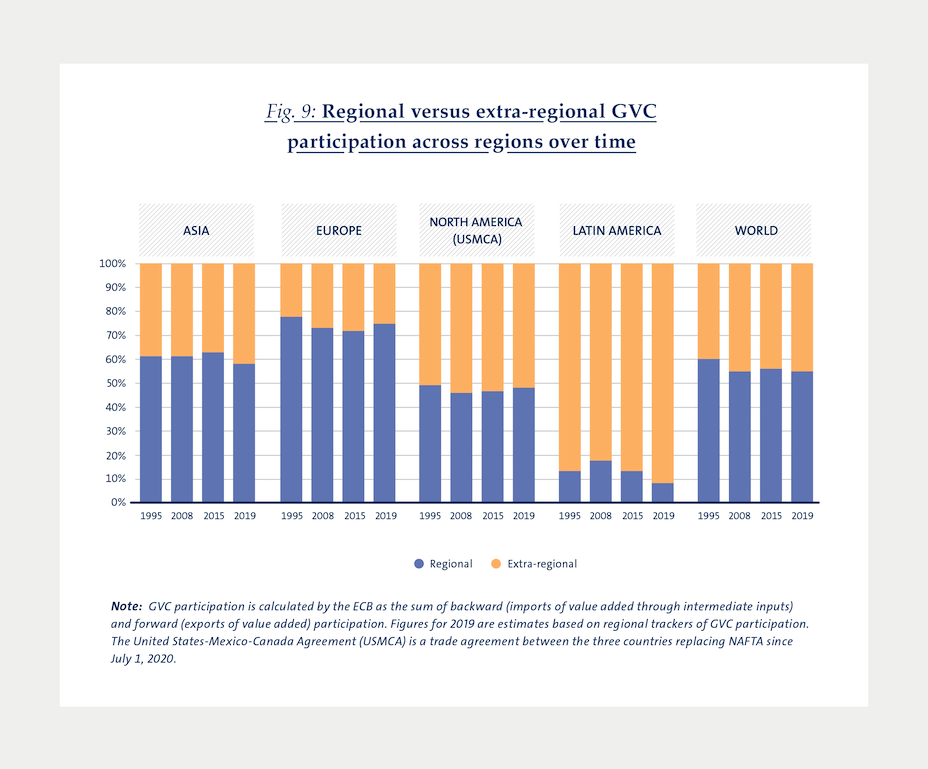
Figure 9 further illustrates this point by decomposing GVC participation of different regions into the contribution of regional and extra-regional trade. The prevalence of regional value chains for most areas, even prior to 2008 is coherent with Figure 8. For countries in Europe and Asia, and to a lesser extent in North America, GVC participation has risen largely on the back of stronger supply linkages within the region itself, while countries in Latin America have become integrated in GVCs by strengthening linkages with partners from other regions.
Since 2011, regional GVC links have somewhat weakened in Asia and Latin America, while in other regions they have remained broadly constant. Overall, supply chains remain clustered at regional level, with no clear increasing trend.
Taking stock, it appears that the evidence pointing towards a deglobalization or slowbalization is limited. The decline of the Trade-to-GDP ratio since the Great Recession is a clear indication that “volumes” of trade are declining, although evidence suggests that part of this can be explained by a substitution of trade in goods by trade in services. However, deglobalization does not simply hint at a decline in “volumes”, but also at a change of the “shape” of globalization. In that respect, there is no evidence that the Great Recession represented a tipping point for global value chain participation. If anything, our statistics show that in that regard globalization has intensified in the most recent decade, allowing small economies (and presumably poorer ones) to integrate the world trade system, even more so at the regional level, and to support more friend-shoring rather than reshoring.
There is no evidence that the Great Recession represented a tipping point for global value chain participation.
Policy Landscape: The role of multilateral and unilateral trade policies
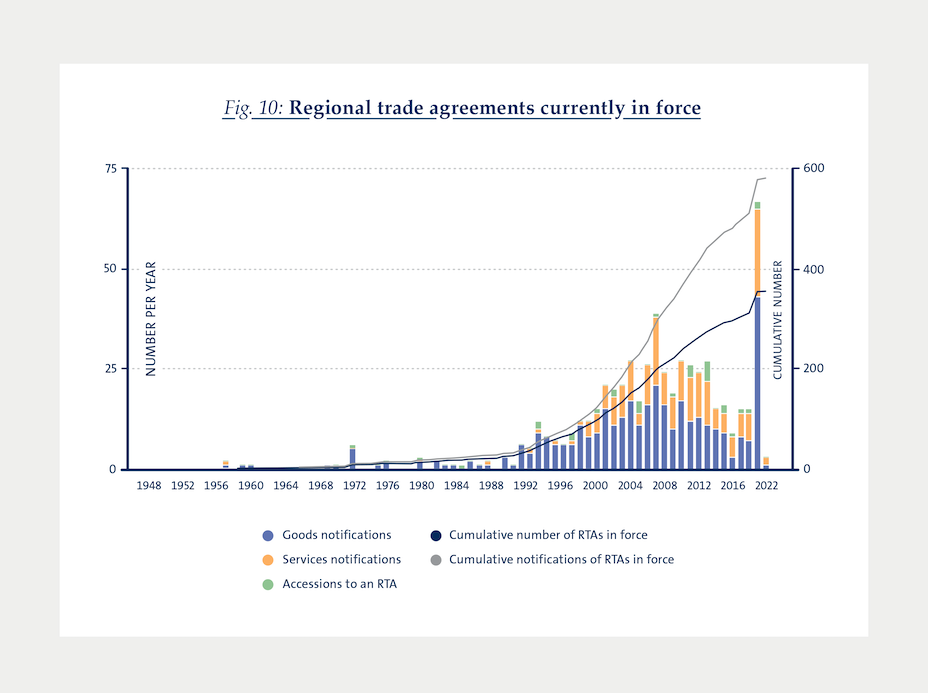
Another fundamental dimension of analysis, for the trends in both globalization and regionalization, is the role played by bilateral and multilateral trade negotiations, as well as (unilateral) protectionist trade policies. Recent decades have seen a proliferation of regional trade agreements (RTAs) which include both free trade agreements and customs unions (Figure 10). As of September 2022, there are 353 of such agreements in force. The coming into being of the World Trade Organization (WTO) in 1995 is considered one of the main reasons for the sharp increase in the number of RTAs. This process of political globalization started to slow down following the Great Recession: the number of notifications per year increased steadily from the mid-1990 and peaked in 2009. It started decreasing slightly between 2010 and 2015, and it decreased even further between 2016 and 2020. The only exception is 2021, as a direct consequence of Brexit: 86% of the RTAs entered into force in 2021 have the United Kingdom as one of the trading partners.
While RTAs are regulated under the WTO and compatible with the global trading system, there is a (growing) view that they can be an obstacle to a more effective and fair global trading system. The large proliferation of RTAs is in fact often considered to be a systemic problem for the WTO, undermining its role as a global negotiation forum while fostering instead bilateral negotiations.
One of the main concerns is that bilateral negotiations are inherently discriminatory. RTAs could be designed to strengthen trade relationships with some countries and purposefully exclude or isolate other economies. In fact, these preferential trade negotiations are conceived to circumvent the Most Favored Nation clause of the WTO, which is about nondiscriminatory handling of trade, by allowing two or more countries to set tariffs to zero just among themselves. A second concern is that the interests of small developing economies are less protected in bilateral negotiations rather than in a multilateral setting. Trade agreements between developed and developing countries – the so-called North-South RTAs – are thought to disproportionately represent the economic interests of the “north”, the part with the strongest bargaining power in the negotiation.
The large proliferation of RTAs is considered to be a systemic problem for the WTO, undermining its role as a global negotiation forum while fostering bilateral
negotiations.
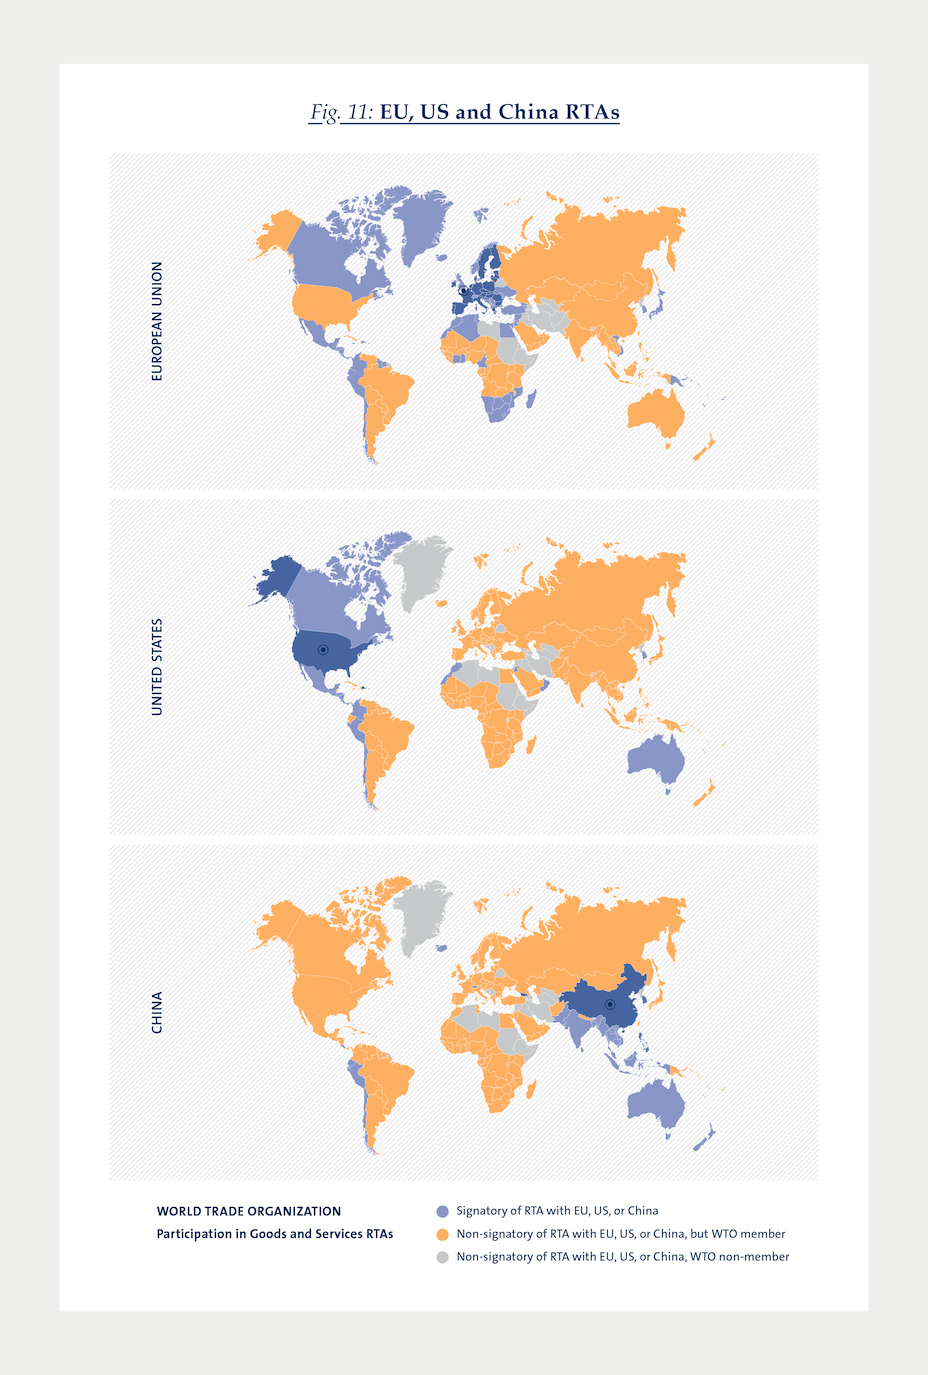
This view is somehow confirmed by looking at the RTAs signed by the EU, the United States and China (Figure 11). The preferential trade negotiations signed by the three largest trading economies in the world are designed to strengthen their geographical influence. The EU with the East-European bloc and the Mediterranean countries; the US with North America and the countries of the Pacific Rim; and China with South East Asia. In light of the above discussion, these RTAs could be seen as the building block for a future trend in both regionalization and friend-shoring. But the extensive use of these instruments might create a sub-optimal outcome in terms of fairness and sustainability compared to multilateral negotiations.
On top of bilateral and multilateral trade liberalization policies, the other important dimension is represented by unilateral protectionist measures. The most recent and most notable examples of such policies are Brexit, and the unilateral tariffs set by President Trump against China in January 2018. As shown in Figure 12, prior to the first package of US tariffs on Chinese solar panels and washing machines, the US tariffs on Chinese exports was around 3%, while the Chinese tariff on US exports was around 7%, both in line with the tariff rates applied to the rest of the world. Following a series of tariff packages and retaliatory responses, tariffs increased to up to 20%.
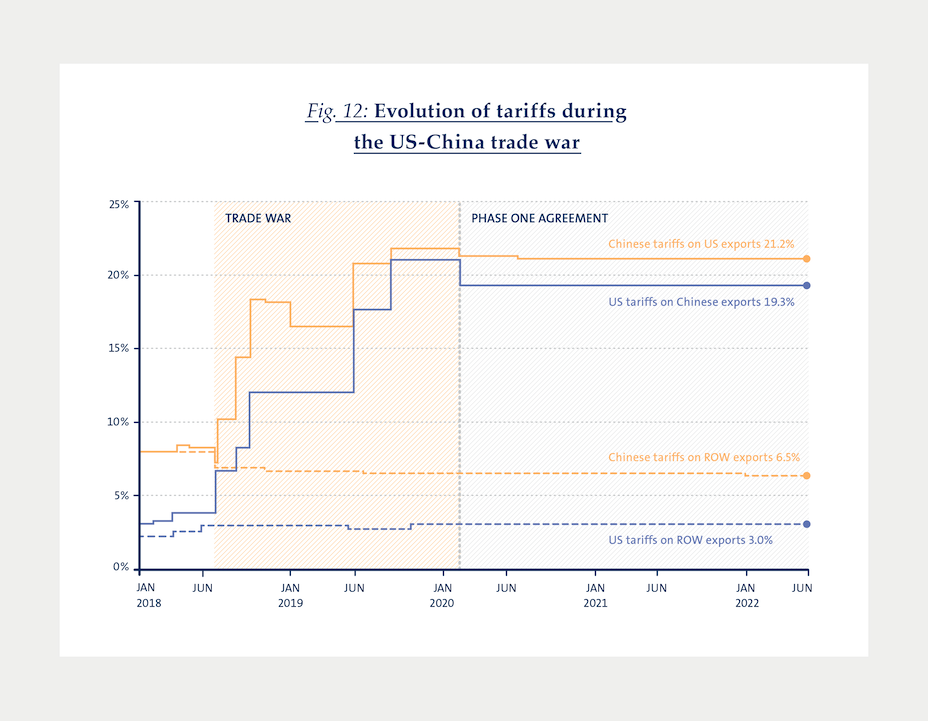
One of the most surprising facts is the stickiness of these tariffs, and how complicated the process of de-escalation is. During the 2020 US presidential campaign, Biden expressed his willingness to end the trade war with China. But since his victory, no changes were made to the tariff schedule vis-à-vis China. Despite the fact that many economic papers showed how detrimental these tariffs were to social welfare, eliminating them does not seem a viable political action.
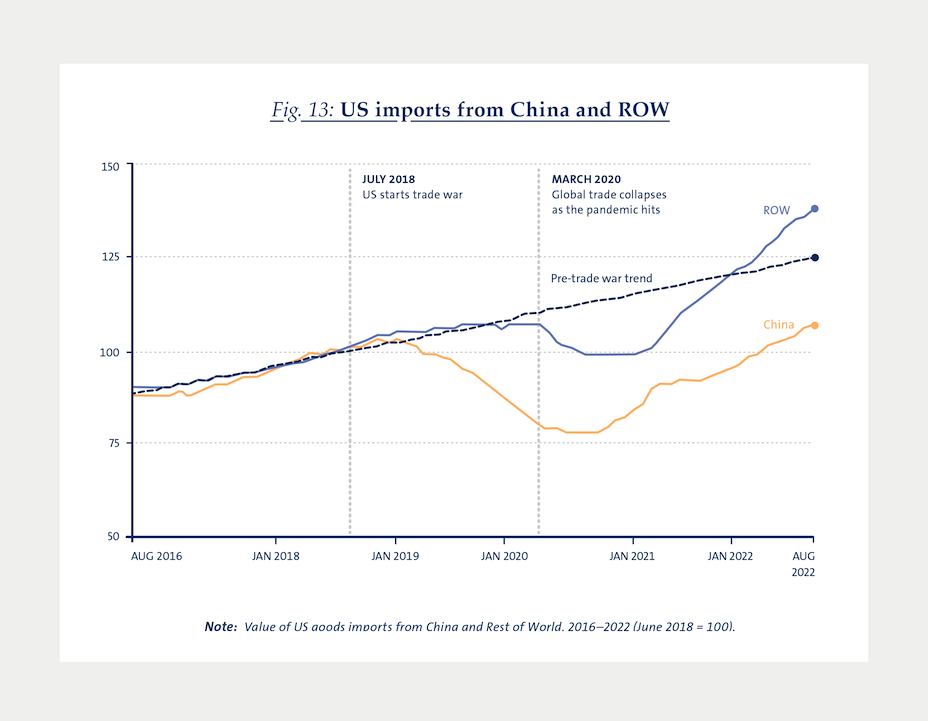
The trade war between the US and China was also motivated by President Trump as an attempt to “decouple” the two largest economies in the World. Four years after the beginning of the trade war, and without a clear sign of a reversal in the imposed tariffs, one could look at the effect of these policies on trade. Chad Bown, in a recent column for The Peterson Institute for International Economics,4 has analyzed the bilateral trade patterns between the two countries, showing that US imports from China have in fact declined in 2018, as a result of the trade war (Figure 13). The COVID-19 pandemic exacerbated this negative impact – on imports from China as well as from the rest of the world. Today, US imports from China have returned to the pre-trade war levels of June 2018, but remain way below the pre-trade war trend. China is now the source of only 18% of total US goods imports, down from 22% at the onset of the trade war.
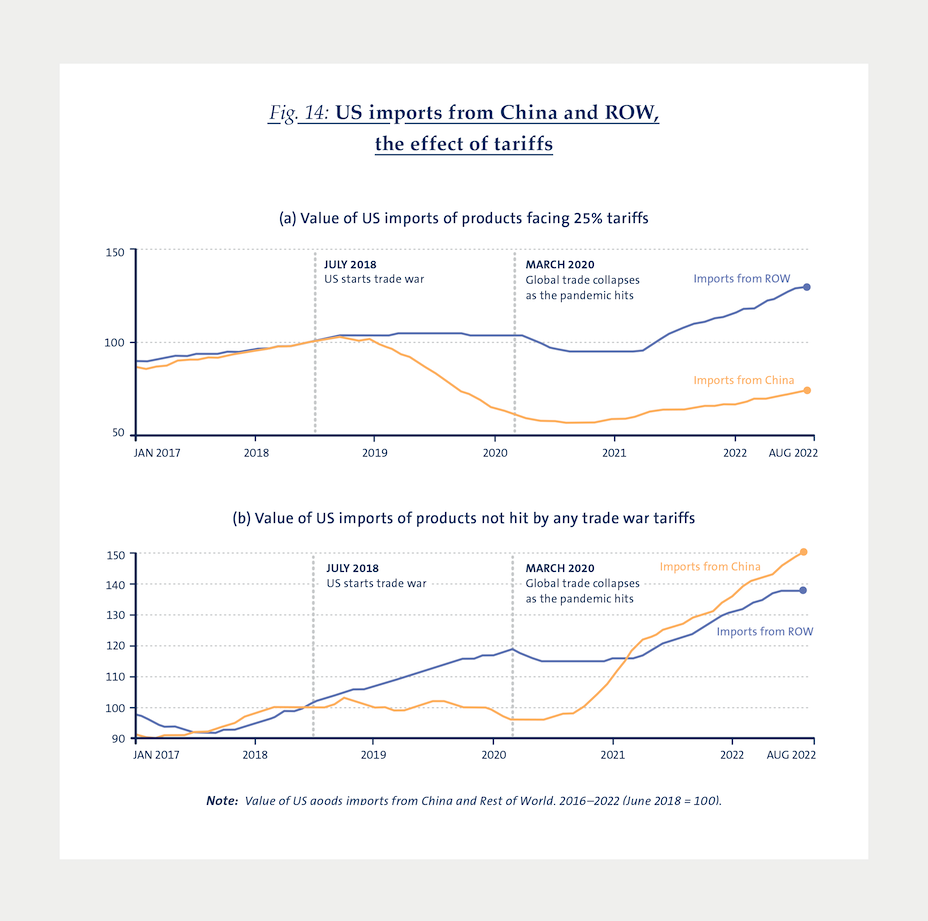
Yet, the two economies did not fully decouple. Not surprisingly, the largest negative impact on imports from China was on products hit with the highest US tariffs (Figure 14 a). Simultaneously, US imports of products that did not face an increase in tariffs surged (Figure 14 b). These were mainly goods whose demand increased in response to the COVID-19 pandemic (e.g. laptops and computer monitors, phones, video game consoles, and toys).
When it comes to setting trade policies, the trend towards deglobalization and protectionism is – at least on the political dimension – definitely more clear. These decisions are not simply political, but have a clear impact on trade and can lead to an attempt to deglobalize or to redraw the patterns of trade towards reshoring and friend-shoring.
Concluding Remarks
Claims of deglobalization have multiplied over the last decade, but the evidence is still mixed. The recent evolution of the global Trade-to-GDP ratio points towards a decrease in globalization in terms of “volumes”. Looking at GVC participation – the “shape” of globalization – the picture substantiates at maximum claims of slowbalization. In terms of “outreach” we see that over time distance is becoming less of a hurdle to trade, supporting views of continuing and increasing globalization. When looking at these facts together, and despite some signs of a slowdown, the main message can still be cautiously optimistic.
The policy landscape, in contrast, gives a slightly more worrying picture. The proliferation of regional trade agreements can be read as an increase in globalization. But these are often used to sediment trends in regionalization and “friend-shoring” rather than fair and non-discriminatory worldwide globalization, which can be achieved only through multilateral negotiations. Moreover, on the political arena, we are experiencing increasing voices against globalization. Recent unilateral protectionist measures, like Brexit or the escalation in the tariff war between China and the US, are already having clear repercussions on trade patterns. And the full impact of these measures is yet to be seen.
- Borin, A. and Mancini, M. (2015). “Follow the value added:
bilateral gross export accounting”. Working Paper Series,
No 1026, Banca d’Italia, July - Head, K., and Mayer, T. (2014). “Gravity Equations: Workhorse,
Toolkit, and Cookbook”. In Handbook of International
Economics (Vol. 4, pp. 131–195) - The 10 largest economies in terms of GDP in 2020 are the
US, China, Japan, Germany, the UK, India, France, Italy, Canada
and South Korea. Including or not intra-EU trade doesn’t
change the estimation results significantly. - https://www.piie.com/blogs/realtime-economics/four-years-trade-war-are-us-and-china-decoupling


More Issues
Variable Carbon Pricing and the Environmental Gains from Trade

Optimal Carbon Tax for Maritime Shipping?

The Global Diffusion of Clean Technology

The Sustainable Globalization Index

The Distributional Effects of Carbon Pricing:

The Green Comparative Advantage:

The EU Emissions Trading System

The Hidden Green Sourcing Potential in European Trade

The European Green Deal

Post-COVID19 resilience

Africa’s Trade Potential

Buy Green not Local

A New Hope for the WTO?

Crumbling Economy, Booming Trade

Pandemic and Trade
The Dynamics of Global Trade in Times of Corona

EU Trade Agreements
Past, present, and future developments