
Outline
In this Kühne Impact Series, we continue our effort to understand the role of international trade in the fight against climate change. Our main contribution is to introduce the concepts of environmental comparative advantage and environmental gains from trade. Our main point is that the environmental gains from trade are large so that trade plays a crucial role in the fight against climate change.
Many consider international trade as one of the leading causes of climate change because of the greenhouse gas (GHG) emissions generated by the transportation of goods across the planet. It is commonly accepted that it is better to consume locally produced goods in order to be environmentally conscious.
At the Kühne Center for Sustainable Trade and Logistics, we have come to oppose this view and advocate for a vision of international trade as a solution to rather than a cause of climate change. Several of our Kühne Impact Series demonstrate that buying green does not necessarily imply to buy local.1
Just as there are economic gains from trade if countries specialize in what they are relatively good at — that is, according to their economic comparative advantage — similarly there are environmental gains from trade if countries specialize in what they are relatively green at — that is, according to their environmental comparative advantage.
A crucial difference, however, is that the economic gains from trade emerge naturally as the outcome of market forces, whereas the environmental gains from trade materialize only with the right policies in place, such as a carbon tax. This is because the social costs of GHG emissions far exceed the private costs without appropriate policies in place.
To quantify the potential environmental gains from trade, we develop a quantitative model of international trade and production and simulate a world economy where carbon is taxed globally and uniformly. We decompose the resulting emissions reduction into three effects: a scale effect, a composition effect, and a green sourcing effect. While the scale effect and the composition effect also arise in a closed economy, the green sourcing effect is inherently about international trade and captures the environmental gains from trade.
We find that a uniform global carbon tax is a remarkably efficient tool to reduce GHG emissions: a tax of $100/tCO2 would reduce current emissions by 27.5% while reducing gross output by only 2.6% and real income by a mere 0.7%. Our main result is that 36% of this reduction in GHG emissions is achieved by leveraging the environmental gains from trade.
The green sourcing potential of international trade can be achieved when countries specialize in their environmental comparative advantage
When accounting for the carbon emissions of both production and transportation associated with tradable goods and services, it becomes clear that we do not need less trade but better trade. Transport emissions represent only a small part of overall trade-induced emissions (in aggregate only one third; at the product level the median contribution for European trade flows is 40%). There is on the other hand substantial heterogeneity across countries in terms of how green the production technology of a given good can be, leading to drastic differences in the amount of emissions caused by the production of the same good or service in different countries.
International trade has in fact a positive role to play in the fight against climate change, by connecting consumers to the green origins of production. In a hypothetical world where production and consumption patterns are kept fixed but origins of production can change, we find that producing all goods locally in the country they are consumed would in fact increase GHG emissions. On the other hand, sourcing goods from the greenest possible origin worldwide could, in the particular example of European trade, lead to a decline of trade-induced emissions of as much as 35%. This is the hidden green sourcing potential of international trade.2
We do not need less trade but better trade.
In the real world, production and consumption patterns, of course, adjust to price incentives. We cannot all buy our agriculture from Switzerland (the greenest producer globally) simply because the country does not have the production capacity to serve the whole planet. If everyone were to try and buy a good from its greenest source, the price of that product would rise relative to other origins, inducing demand to shift to other producers with potentially worse outcomes in terms of GHG emissions. It would, however, suffice that price signals incentivize consumers to buy their products from countries that are relatively greener at producing a good given their economic production capacities. In other words, producers should specialize in their environmental comparative advantage.
To illustrate this concept consider the example of China and the United States producing textiles and machinery. Perhaps surprisingly, the United States are browner at producing both goods than China. This is, among other reasons, because China has made the greenification of its largest industry-heavy sectors a priority of its 13th Five-Year Plan.3 However, if we compare both sectors within a country, the United States are relatively greener at producing machinery than textiles (with an emission intensity of 22 kg CO2/$ compared to 43 kg CO2/$), whereas China is relatively greener at producing textiles than machinery (with an emission intensity of 17 kg CO2/$ compared to 20 kg CO2/$). If the whole world were only sourcing both products according to Chinaʼs absolute environmental advantage, not only would quantities be lower in both sectors, but prices would rise, making China less attractive than the U.S., with the risk of leading consumers to buy both products from the U.S., thereby generating more emissions. The better outcome is to source machinery from the U.S. and textiles from China, so as to maximize quantities and minimize emissions.
Environmental gains from trade can be driven by countries specializing in what they are relatively greener at producing.
This example illustrates the idea that – just as the economic gains from trade are driven by countries specializing in what they are relatively more efficient at producing – the environmental gains from trade can be driven by countries specializing in what they are relatively greener at producing.
Carbon pricing allows to unlock the green sourcing potential of trade
However, while market forces drive countries to specialize according to their economic comparative advantage, there is no reason in today’s economic context to drive countries to specialize in their environmental comparative advantage. This is because greenhouse gas emissions are what is called in economics a negative externality: the cost of emitting an additional ton of CO2 for a firm burning fuel to produce its good or for a household burning gas to heat its lodging is virtually zero, whereas the social cost of that extra ton will manifest in the monetary damages resulting from, for example, burning crops, health-care costs from heat waves or drought, or loss of property from flooding. When this social cost is not reflected in the price of what we consume daily, this is a market failure.
To correct this market failure many economists have promoted the idea of a carbon tax. Carbon pricing means calculating the “social cost” of GHG emissions by quantifying the dollar net present value of these damages and tying it back to their source through a price, usually in the form of a tax on tons of CO2 emitted.4 Instead of dictating who should reduce emissions where and how, a carbon price provides an economic signal to emitters, and allows them to decide to either transform their activities and lower their emissions or continue emitting and paying for their emissions: it is a market-based solution. Only with such a price on emissions can firms be induced to specialize in (cheaper) greener production, thus unlocking the green sourcing potential of international trade.
At the Kühne Center our focus is on understanding and quantifying this green sourcing potential of international trade. To that effect, we simulate the optimal pattern of production and trade in a world where carbon is priced globally and uniformly at its social cost and describe this counterfactual world as the “sustainable globalization.”
The sustainable globalization can be achieved through three mechanisms: a scale, a composition, and a sourcing effect
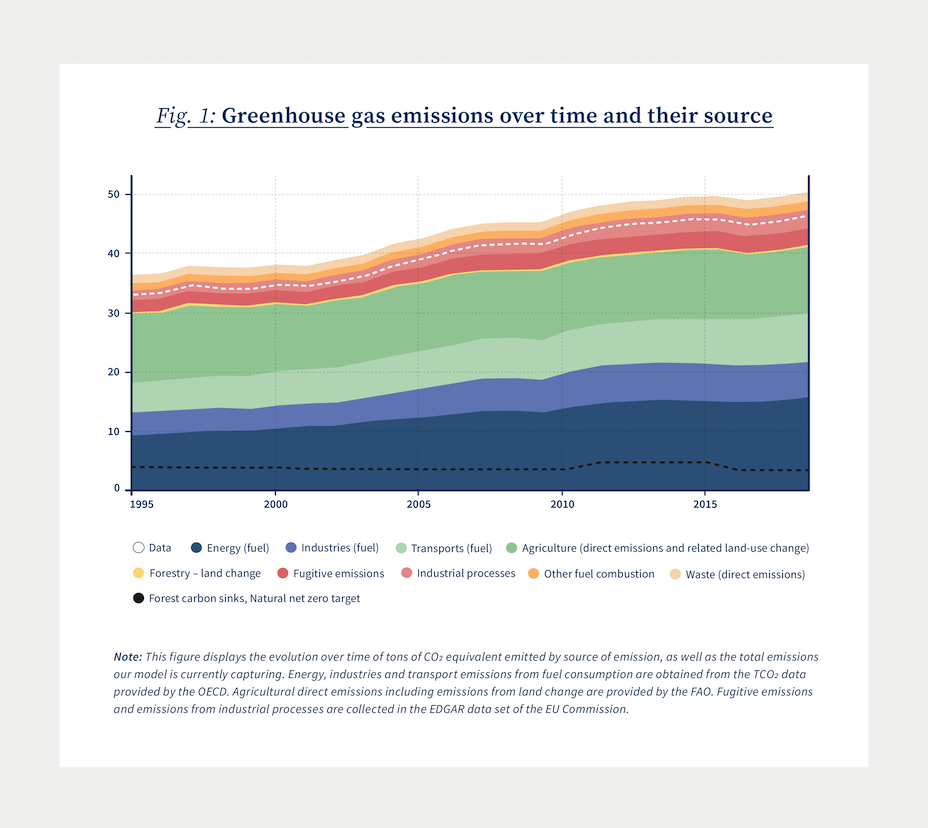
We simulate a world economy with 64 countries (including a residual Rest of the World aggregate) and 48 sectors of economic activity in 2018. Countries are characterized by consumers who buy final goods both domestically and through imports, and firms that produce these goods using intermediate inputs that they buy from other firms both domestic and foreign.5 The production of goods for both final and intermediate use is at the source of carbon emissions: from fuel burnt to run machinery to gas extraction for household heating, including direct emissions from enteric fermentation in the cattle sector or from cement creationʼs chemical processes (see Fig. 1 for a representation of the data. In 2018, our coverage accounts for 93% of global emissions, including emissions in methane and nitrous oxide).
A carbon taxation implies that for any ton of CO2 emitted at every step of the production process (direct emissions) the producer must pay the extra cost of carbon. This cost will be reflected in the final price paid by customers, but also in the price of intermediate inputs bought by other firms, therefore changing patterns of consumption, production, and trade. Individual countriesʼ and sectorsʼ differences in production technology and energy mix — reflected by their production emission intensities — will lead to heterogeneous effective carbon costs. This will be the main driver of changes in the pattern of trade.6
By putting a price on carbon emissions, a carbon tax will make brown goods from brown origins relatively more expensive. Moving away from such goods will cause emissions to decrease. This general mechanism can be decomposed in three contributing factors of emissionsʼ reductions: (i) a scale effect, (ii) a composition effect, and (iii) a sourcing effect.
Keeping production and consumption patterns fixed, by increasing the price of all products by their carbon cost, the carbon tax will lead to an overall decline in quantities consumed and produced, which will mechanically decrease emissions: it is the scale effect. Considering the scale of consumption and production as well as their geographic origin fixed, the carbon tax will increase the price of brown sectors relatively more than that of green sectors. For example, manufacturing goods (that are globally quite carbon intensive) will become more expensive regardless of their origin than any electric equipments from anywhere (as electric equipments are relatively significantly greener). As a result, consumption will be diverted away from brown sectors towards green ones, thereby reducing global GHG emissions: it is the composition effect. Finally, keeping volumes of production and consumption fixed across the sectors, countriesʼ differences in production technology will lead to heterogeneous effective carbon costs for a given product: for example, Finlandʼs wood sector (with an effective additional carbon cost of $0.9 per dollar of wood produced) will be relatively much cheaper than the Indonesian one (with an effective additional carbon cost of $28.9 per dollar of wood produced). As a result, the price of a given good will be relatively cheaper when coming from a green producer than a brown one, leading to a shift of consumption away from brown origins towards green ones, thereby reducing global production emissions for this product: this is the sourcing effect at the center of this Impact Series.
Note that while the scale effect and the composition effect can occur in a closed-economy world, the sourcing effect is fundamentally about international trade: it shows that a key role of international trade in the fight against climate change is to connect consumers to green producers.
More than one-third of global emissionsʼ reduction from carbon pricing is due to the environmental gains from trade
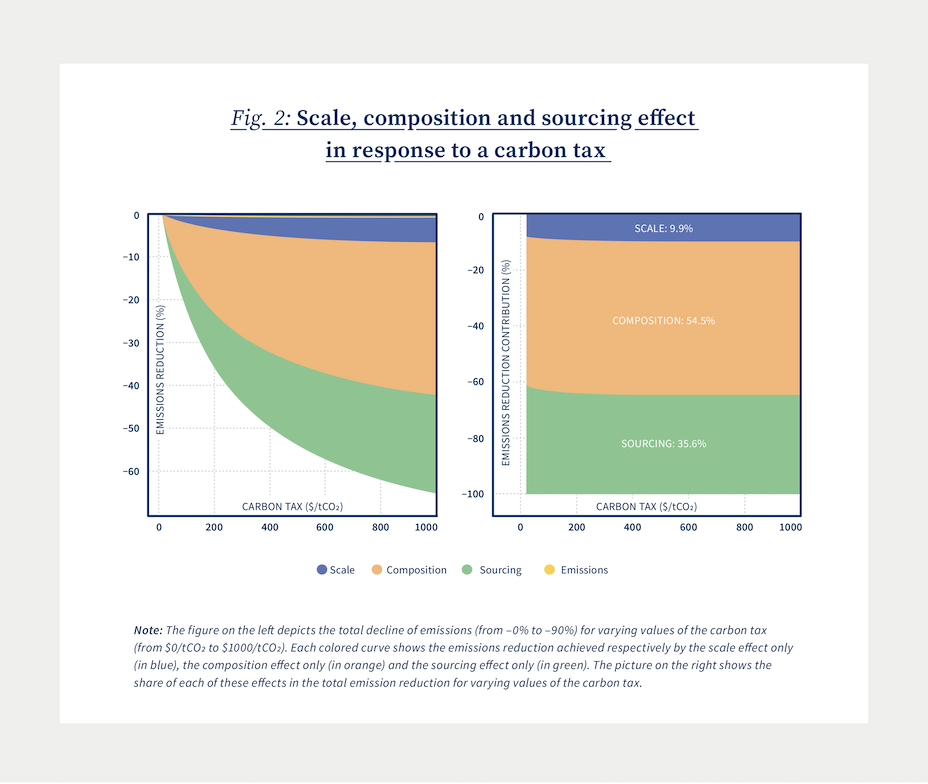
Figure 2 quantifies the contribution of each of these effects to the total emission reduction achieved by a uniform and global carbon tax, for varying values of the price of a ton of carbon. Three key messages can be derived from it. First, a global and uniform carbon tax appears to be extremely efficient to decrease GHG emissions at a low cost: a global price of carbon of $100/tCO2 would for example lead to a decline in global emissions of 27.5% for a gross output decline of only 2.6% and a real income decline even smaller of 0.7%. This would bring us forward by 14 years on the emissions mitigation pathway that would keep us below the 2°C global warming target of the Paris accord with 66% uncertainty.
A global and uniform carbon tax appears to be extremely efficient to decrease GHG emissions at a low cost.
Second, the contribution of these three effects — scale, composition and sourcing — appears to be extremely stable regardless of the value of the carbon tax: past the threshold of a $200/tCO2 carbon tax, the relative contribution of each effect does not change much. This suggests that their relative contribution is triggered solely by the signal that the carbon tax represents on emissionsʼ costs. The size of the penalty that the tax carries (the effective carbon price) will only affect the scale of these effects (how many emissions are effectively saved), not how they interplay. Third, the green sourcing potential of international trade is substantial. The contribution of the green sourcing effect to the reduction of emissions in response to a $100/tCO2 carbon tax is 35.6%: in other words, more than a third of the decline in emissions that we can achieve if we price carbon at its social cost comes from the green sourcing potential of international trade.
To further illustrate the positive role international trade can play by bringing about a sustainable globalization, we will continue the analysis of a counterfactual world with a $100/tCO2 carbon tax.
The sectoral-composition effect manifests in a shift away from agriculture, energy and raw materials towards manufacturing goods and services
As illustrated above, the scale effect contributes the least to the reduction of emissions induced by carbon pricing (9.8%). In a world without technological innovation or carbon sinks like the one simulated by our model, decreasing emissions implies decreasing production and consumption to some extent. Despite this mechanical effect of our model, global gross output declines only by 2.6% in response to a $100/tCO2 carbon tax.
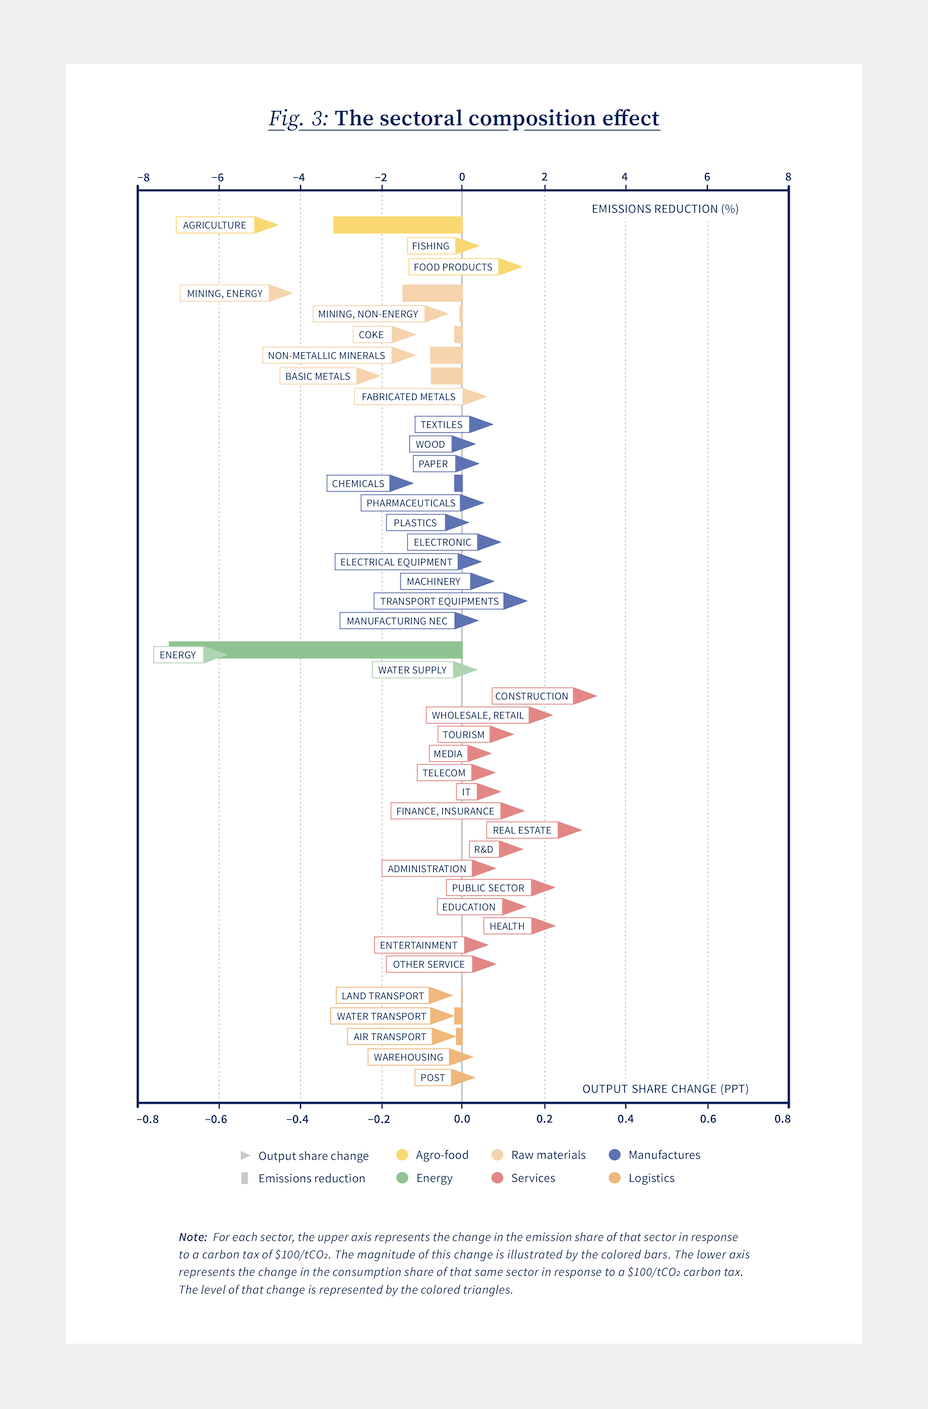
The composition effect has the largest contribution to the decline in emissions (55%). Emissions are reduced because the output share of sectors that tend to contribute relatively more to global emissions is adjusted down. This is illustrated in Fig. 3, where each triangle represents the change of a given sectorʼs weight in the global production basket, and each bar the corresponding gain in global emissions.
By far the largest emission reductions come from two outliers: agriculture and energy. Both see relatively larger declines in their production share in response to a global carbon tax (respectively 0.5 and 0.6 percentage points), for the largest emission declines (resp. 3.2% and 7.3% of global emissions). This can be explained by the fact that both these sectors are predominant in the global production basket — as essential goods for consumption and production they represent cumulatively about 6% of global output —, and the two most carbon-intensive sectors. Note that such large declines in production are plausible for two reasons. First, by construction of our data our sectors are rather coarse and hide potentially large reallocations across subsectors. In the agricultural sector, livestock production is by far the most polluting subsector while representing a very large fraction of agricultural output both directly (meat production) and indirectly (animal feed).7 A global change of diet towards vegetarian options would bring about significant decline in both gross outputs and emissions without necessary threatening consumption needs. Second, general equilibrium effects may explain large declines in the output of upstream materials for brown sectors. Energy being upstream of all sectors of production, a global decline of output by 2.6% plausibly implies a decrease of energy requirements across the entire input-ouptut structure of the economy.
For the remaining sectors, we observe overall a reallocation of production away from brown industries towards green ones: the weight of services and of most manufacturing goods increases in the global production basket, whereas the share of transports, raw materials and energy declines. Despite an increase of their output share, there is no significant increase in global emissions associated with the reallocation of production towards services or most manufacturing sectors. This is because they contribute very little to global emissions relatively to how much they are consumed. Conversely, the decline in the output share of transportation sectors generates little emission reductions, as they donʼt weight particularly much in global emissions relative to how needed they are in production and consumption.8 This illustrates the contribution of the composition effect to total emissions declines.
The scale effect and the composition effect can drive emissionsʼ reductions even if all countries were living in autarky. In truth, however, such large reallocations of production can only be achieved efficiently if countries are specializing according to their economic and environmental comparative advantage. In other words, one would not achieve a 18% reduction of global emissions (64.4% of the 27.5% decline obtained with a $100/tCO2 carbon tax) in a world with no international trade. However, by allowing consumers to exploit the technological differences across producers, international trade generates both economic and environmental gains from trade. The sourcing effect contributes an additional 35.6% of the global emission decline.
Patterns of green sourcing lead to an aggregate shift of trade from the South to the North and to individual green specializations
For any given sector, there is a large discrepancy across countries in terms of the emissions generated by one dollar of good produced. For example, in the sector of coke production (industrial coal), Australia emits 1316 kg of CO2eq. per dollar produced, whereas Argentina emits 350 kg of CO2eq. Because the global contribution of Australia and Argentina to the global production of coke is roughly similar (resp. 5.13% and 5.12%), this gap in technology explains the large discrepancy in their relative contribution to total emissions induced by this sector (resp. 1.5% and 0.4%). In response to a $100/tCO2 carbon tax, the contribution of Australia to global production of coke decreases by 0.09 percentage points, whereas the output share of Argentina increases by 0.002 percentage points, inducing a net decrease of global emissions (–0.01% for Australia, no increase in emissions from Argentina). When extended to all countries of the globe and across all sectors, this mechanism alone generates a decline in global emissions of 9.8%: these are the environmental gains from trade.
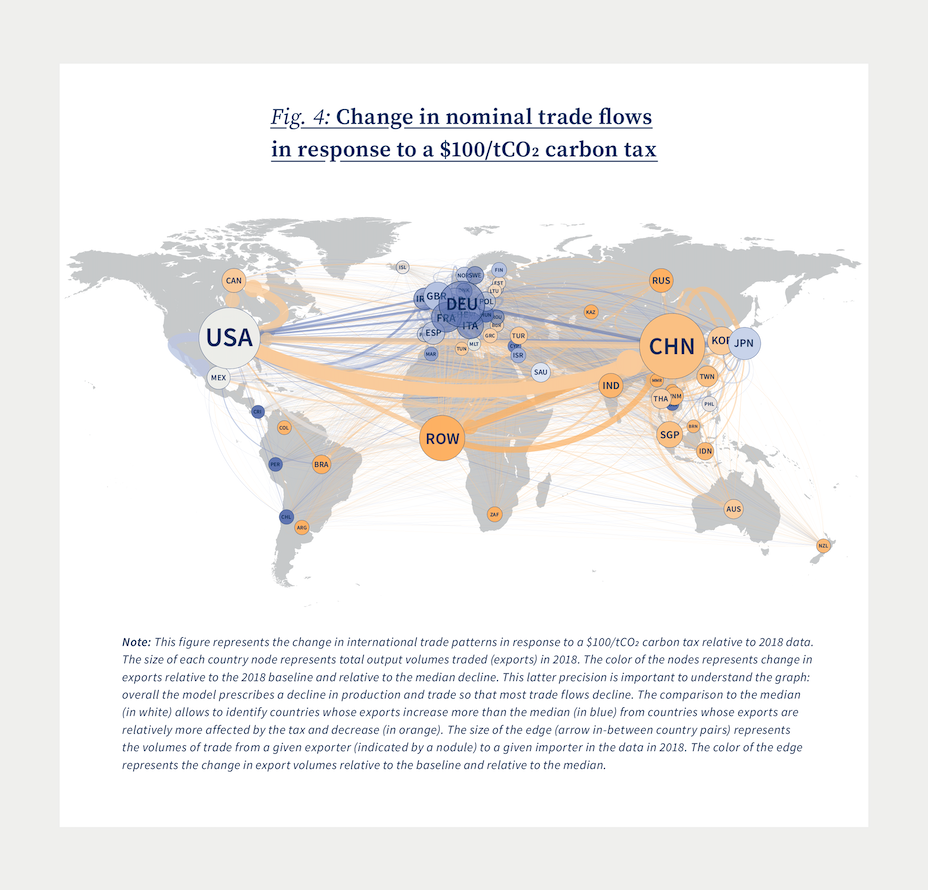
At the aggregate level, as for sectors, some countries tend to contribute relatively more to global production than to global emissions, so that they tend to be favored as a green sourcing origin in response to a carbon tax. And vice versa, some countries are large emitters above and beyond their production share, so they tend to see their output share decline in order to reduce emissions. As illustrated in Fig. 4, this reallocation occurs in favor of countries of the economic North (e.g., Germany, Japan, Finland, the U.S.) who are large output contributors but relatively green producers, away from countries of the South (e.g., South Africa, Peru, Cambodia) and the BRICS who tend to contribute more to global emissions than to global output.9
To provide a few concrete examples, aggregate trade from China to the Rest of the World — which comprises most African countries except for Maghreb and South Africa — declines by 11% in response to a $100/ tCO2 global carbon tax, and the inverse flow by 14%. At the other end of the spectrum, trade from Germany to France or the U.S. remains virtually unchanged (respectively +0.5% and –0.8%). Interestingly, trade within NAFTA shifts in favor of US-Mexico trade and away from US-Canada trade.
At the sector level, however, there are no such clear-cut geographic patterns of trade reallocation. The economic and environmental comparative advantage of a country reflects the interaction of labor costs, natural resources, and productivity, leading to sometimes surprising reallocations.
For example, Chileʼs production technology is relatively brown across the sectors, so its output share declines on aggregate. However, the natural geography of Chile makes it relatively greener at producing copper and cotton so that its export share of agricultural goods and basic metals increases significantly (de facto, Chileʼs share of global trade in basic metals increases by 40%). At the other extreme, Norway is known to have massive resources in petroleum (sector of mining energy, which represents 13% of Norwayʼs production in 2018). However, because the country has some of the greenest technology of production in many other sectors, Norwayʼs production share in the mining energy sector in response to a $100/tCO2 carbon tax declines (albeit by only 0.5%), freeing up production capacities for other sectors such as the sectors of wood, plastic, and energy (electricity). Going back to our example of China and the U.S. from the beginning of this series, it turns out that China will indeed specialize even further in textiles in response to a carbon tax, along with electronics and the wholesale and retail trade sector. The U.S. on the other hand will indeed further specialize in machinery, manufacturing and transportation equipment.
Buying green not local does not imply more trade, it simply implies better trade
The green sourcing effect will lead to an increase in trade flows where it is most needed. The energy sector is a particularly good example: in the absence of a carbon tax, it is very little traded (only 1.25% of global Energy output) and contributes the most to global emissions (28%). By incentivizing consumers and producers to seek the relatively greener origins, the carbon tax leads to an increase in the share of output traded of the energy sector by 30%. European countries remain important exporters, with a large increase of intra-EU trade flows from the northeast part of the continent, but new exporters enter the market in response to the carbon tax: for example New Zealand, whose export share in the Energy sector triples to serve mostly Oceania and Southeast Asia, or Colombia, whose share doubles. The share of global emissions saved by this intensification of trade — predominantly within continental regions — is 4.6%.10
Interestingly, the green sourcing effect can also imply that consuming local is environmentally more desirable than trade in some cases. The best example of this is the agricultural sector. In the absence of a carbon tax, agricultural goods are heavily traded (with a share of output traded of 7%), and the largest exporters worldwide are sub-Saharan countries aggregated in the Rest of the World, the U.S., and Brazil. However, both the Rest of the World and Brazil are extremely car- bon-intensive producers of agricultural goods. As a result, the green sourcing effect leads to a drastic decline of their output share in favor of an increase in the output share of most of the other countries globally (in particular China), for a global gain of –5.2% in GHG emissions.
These examples illustrate the true meaning of our motto “Buy Green not Local.” The green sourcing potential of international trade does not imply a massive increase in the volume of trade flows globally. In fact, in the case of a $100/tCO2 carbon tax, the share of global output traded stays constant at 13%. However, it implies trading more where emissions can be saved, and less where emissions cannot be avoided, thereby allowing trade to play an instrumental role in the fight against climate change.
Conclusion
In this Kühne Impact Series, we took a fresh look at the role of international trade in the fight against climate change. With the use of a modern quantitative model of production, consumption, and trade, we operationalize the notion of “sustainable globalization” and simulate the global pattern of trade that would prevail if carbon were priced at its social cost. Our main result is that more than a third of the potential global GHG emissions reduction achieved by a global carbon tax is due to the environmental gains from trade.
- See our Kühne Impact Series “Buy Green not Local: How international trade can help save our planet” (03/2021) for a detailed discussion of heterogeneity in emission intensities across producing countries and sectors.
- See our Kühne Impact Series “The Hidden Green Sourcing Potential in European Trade” (01/2022).
- See the 2017 OECD study on the “Industrial Upgrading for Green Growth in China”: Industrial_Upgrading_China_June_2017.pdf While being the worldʼs largest polluter in absolute term, China has placed energy efficiency at the top of its priorities in its 10th and 11th Five-Year Plans, and carbon emission reductions in its 12th and 13th Plans.
- To put this number in perspective, a new car in 2021 emits around 1 ton of CO2 per 10,000 km, which is close to the average distance travelled by a car in a year (e.g., Germany: 13.602 km per year, Italy: 8,464 km per year). A good rule of thumb to represent a ton of CO2 is therefore to consider the tailpipe emissions of a car within a year.
- For a complete description of the model and an exhaustive list of data sources, see Le Moigne, Lepot, Ossa, Ritel, and Simon (2022). “A Quantitative Analysis of Sustainable Globalization” (Working Paper).
- A few key assumptions are worth mentioning. First, the model assumes constant technology in response to the carbon taxation (“no greenification” of production). This implies that we quantify the reduction of emissions without having to assume massive technology changes but limits the possibility to quantify incentives to invest in green technologies, which are in fact necessary to really achieve net zero. Second, the tax on carbon emissions is levied by national authorities (not by a supranational government) and redistributed directly to domestic consumers. Again, this has the benefit of simplifying the quantitative assessment by allowing us to consider countries as isolated political entities, but excludes the possibility of strategic interactions, which are one of the main hurdles in implementing a carbon tax globally.
Finally, in the current version of the results the trade elasticity of all sectors is equal to 4: this means that the consumption response to a change in the price of imports is the same across all sectors when in reality the sensitivity of our consumption of food to prices tend to be much stiffer than our reaction to a change in the price of transport services for example. - Detailed data on agricultural production and emissions are publicly available and easily accessible.
- The role of transportation in our model is perfectly symmetric to any other sector of production. We are currently exploring ways to allow transportation inputs to scale up if a product is destined to be traded.
- We will explore this North-South division further in our next Kühne Impact Series: “The distributional effects of carbon pricing: A global view of common but differentiated responsibilities.”
- Two points need to be emphasized here. First, part of the increase in the trade share of energy is mechanical: we mentioned above that the gross output of energy declines significantly in response to the carbon tax. If trade flows decline relatively less than gross output (which includes domestic consumption), the ratio of the two has to increase. Second, note that the energy sector encompasses both electricity and gas. The model accounts at least partially for the fact that electricity is not easily traded on long distances thanks to the perfect calibration of the trade costs, but we do not have enough detail to know how strong the (environmentally desirable) substitution between gas and electricity would impact the aggregate effect on long-distance trade in energy. As such the observed patterns of trade are not implausible and remain predominantly continental.
More Issues
Variable Carbon Pricing and the Environmental Gains from Trade

Optimal Carbon Tax for Maritime Shipping?
The Global Diffusion of Clean Technology

The Sustainable Globalization Index

The Distributional Effects of Carbon Pricing:

Global Trade

The EU Emissions Trading System

The Hidden Green Sourcing Potential in European Trade

The European Green Deal

Post-COVID19 resilience

Africa’s Trade Potential

Buy Green not Local

A New Hope for the WTO?

Crumbling Economy, Booming Trade

Pandemic and Trade
The Dynamics of Global Trade in Times of Corona

EU Trade Agreements
Past, present, and future developments


