Impact Series: 02-23
The Distributional Effects of Carbon Pricing:
A Global View of Common but Differentiated Responsibilities

Outline
In this Kühne Impact Series, we focus on the distributional effects of climate action. We simulate the distributional effects of a global carbon tax - the optimal economic policy tool in the fight against climate change - with or without international redistribution schemes. Our main result is that the economic costs of climate action are disproportionately borne by poor countries, but that realistic cross-country transfers could remedy this inequality. For example, annual North-South transfers of an average $200 per person would suffice to equalize the economic costs of climate action.
Economists have long advocated for carbon pricing as the optimal policy response to climate change. The idea is to raise the costs of greenhouse gas (GHG) emissions from their private to their social levels by imposing a global and uniform tax on the amount of CO2 emitted by production and consumption. To quote Nobel laureate Jean Tirole: “Since the emission of a ton of greenhouse gases causes the same environmental damage, wherever, whenever and however it is emitted, a single global price for CO2 should guide public and private agents in their investment, production and consumption decisions.”1
Politically however, this notion of a single common price is strongly contested for at least two reasons.
First, the environmental damages of GHG emissions are in fact highly unequal across the globe, as demonstrated repeatedly by the Intergovernmental Panel on Climate Change (IPCC) in the report of their second working group.2 To paraphrase the 6th Assessment Report, regions and people with considerable development constraints have high vulnerability to climatic hazards. Global hotspots of high human vulnerability are found particularly in West, Central and East Africa, South Asia, Central and South America, and Small Island Developing States.
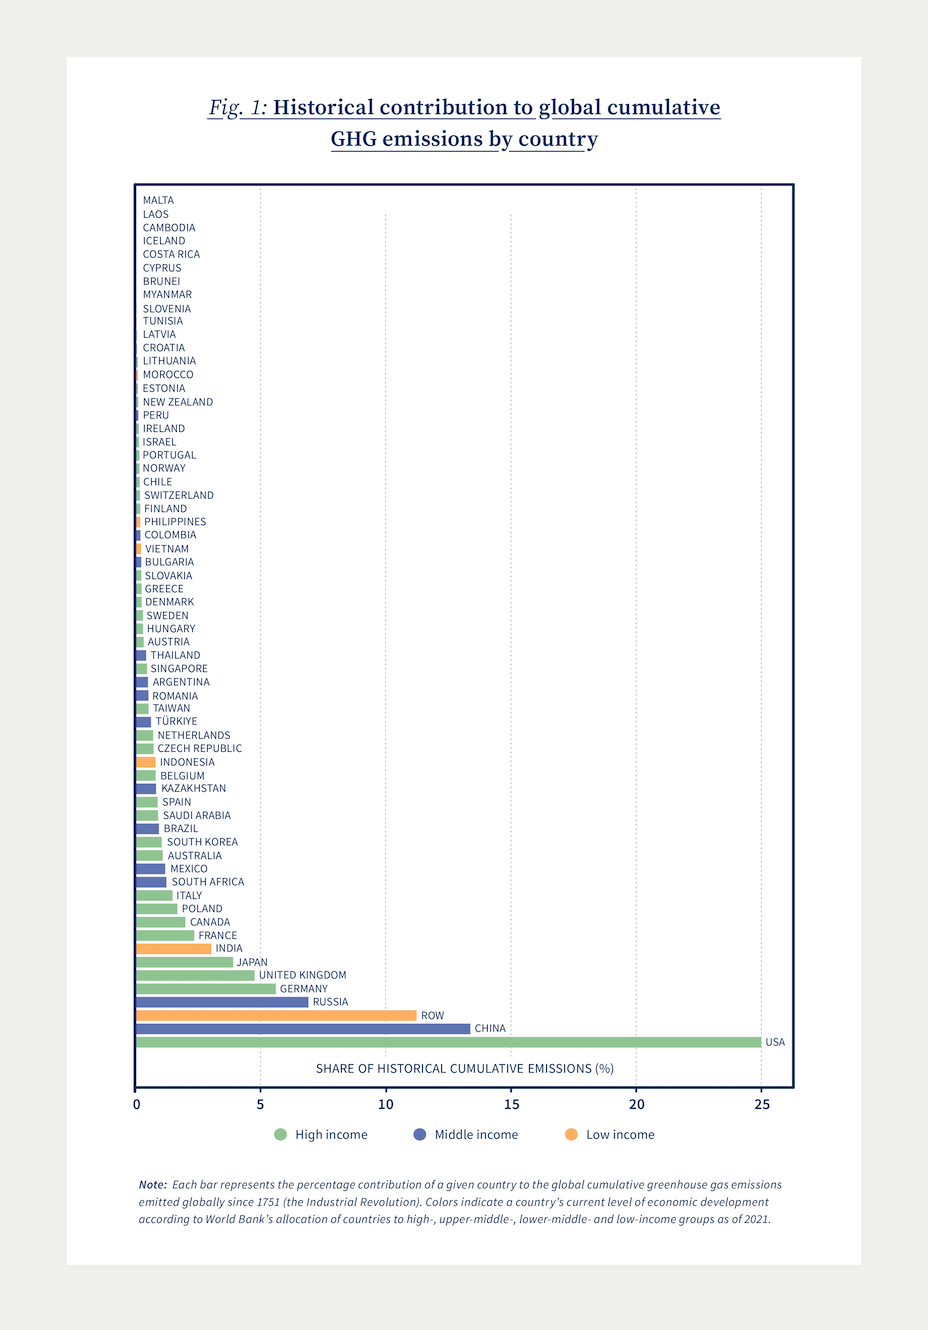
Second, historical contributions to global warming and cumulative stocks of GHG in the atmosphere are also extremely heterogeneous across countries and levels of development. Since the Industrial Revolution (1751 is commonly taken as starting point), the world has emitted over 1.5 trillion tonnes of CO2.3 As of 2020, it was estimated that 25% of this amount was emitted solely by the United States (400 billion tonnes), and 22% by the 28 countries of the EU, as depicted in Figure 1. China is the second largest national contributor with cumulative emissions of 238 billion tonnes, but their contribution only picked-up in the 1960s. Many of the large annual emitters today (e.g., India, and Brazil) are not large contributors historically. Africaʼs regional contribution has been very small relative to its population size.
Developing countries have therefore pushed for decades for a differentiated contribution of countries in the fight against climate change, recognizing that they suffer the most from climate impacts, while having contributed the least to the problem. This notion was first formalized in the United Nations Framework Convention on Climate Change (UNFCCC) of Earth Summit in Rio de Janeiro in 1992, with the principle of – Common but Differentiated Responsibilities (CBDR). It acknowledges that all states have a shared obligation to address environmental destruction but denies equal responsibility of all states with regard to environmental protection.
Differentiated responsibilities recognize that developing countries suffer the most from climate impacts, while having contributed the least to the problem.
In this Kühne Impact Series, we propose a quantitative analysis of this reasoning. In a first part, we simulate the distributional effects of a global and common carbon tax (optimal climate policy) of $100/tCO2 and show that the economic costs of climate action are disproportionately borne by poor countries. In a second part, we explore various international schemes aimed at delivering climate justice and argue that realistic transfers can remedy this.
Economic costs of climate action are disproportionately borne by poor countries.
The distributional effects of a global and common carbon tax that ignores the CBDR principle strongly favors developed countries
A global and common carbon tax implies that one tonne of CO2eq. emitted over the course of the production process costs the same dollar amount to the producer (and ultimately to the consumer) “wherever, whenever and however it is emitted.” In practice, differences in production emission intensities (how much CO2eq. is emitted for each dollar produced) will generate differences in the effective cost of carbon across producers, and differences in the consumption basket of individuals (in terms of goods and services consumed and origins of production) will induce differences in the effective carbon cost across consumers.
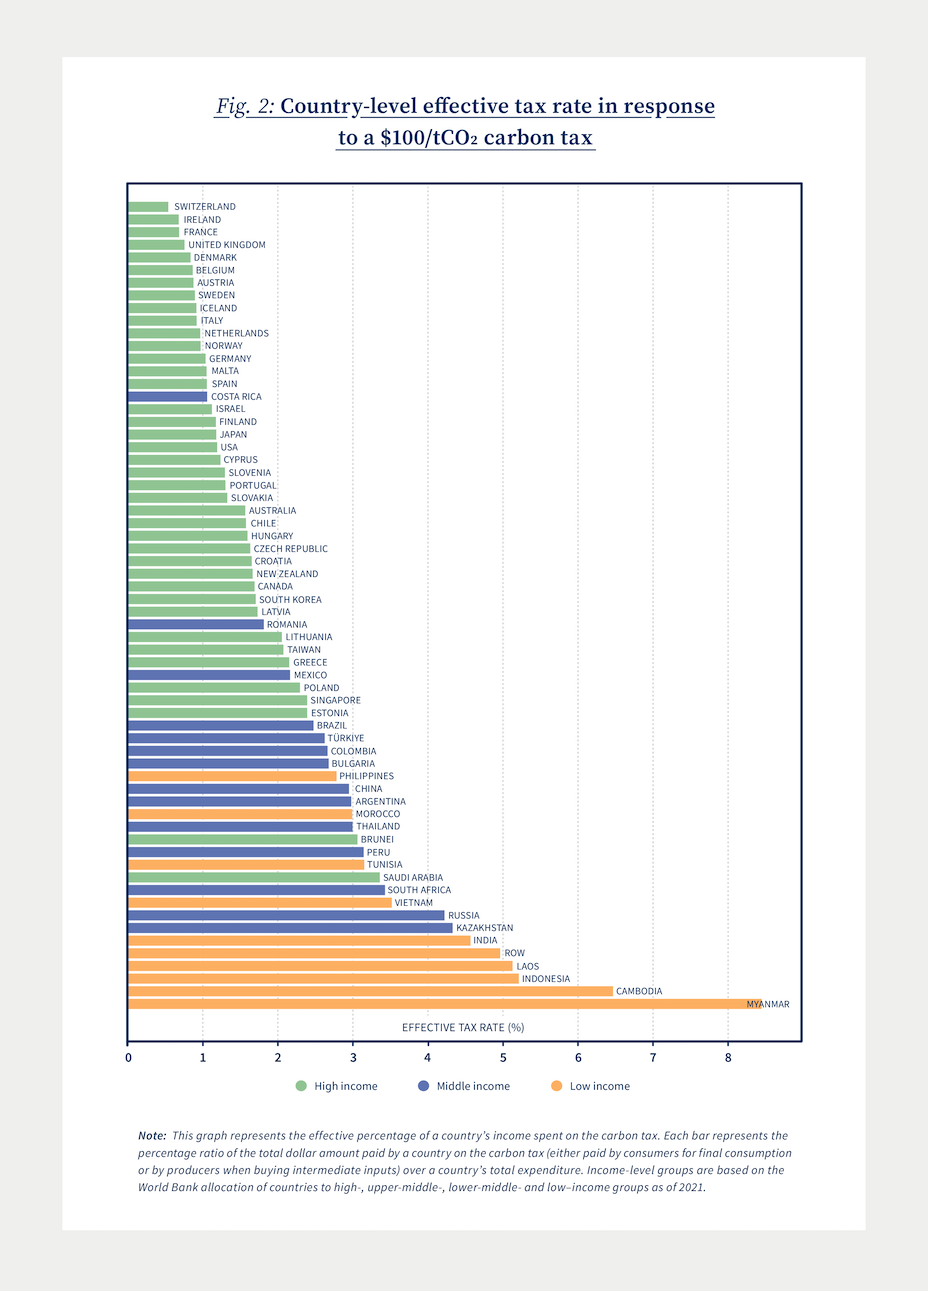
Figure 2 illustrates this by presenting the effective tax rate paid by different countries in the context of a global and common $100/tCO2 carbon tax, that is, the fraction of a countryʼs income effectively spent on the carbon tax. There is no ambiguity as to the fact that the highest effective tax rates are paid by low-income countries such as Myanmar (8.6%), Indonesia (5.1%), sub-Saharan Africa (largest group in the ROW aggregate, with a rate of almost 5%), and middle-income countries (e.g., Argentina with a rate of 3% or Mexico with a rate of 2.1%). High-income countries on the other hand have low effective rates, with Switzerland having the lowest effective tax rate at less than 0.5% of their income, and the largest EU members such as France and Germany all having a rate lower than or equal to 1%.
The highest effective tax rates are paid by low-income countries while high-income countries have low effective rates.
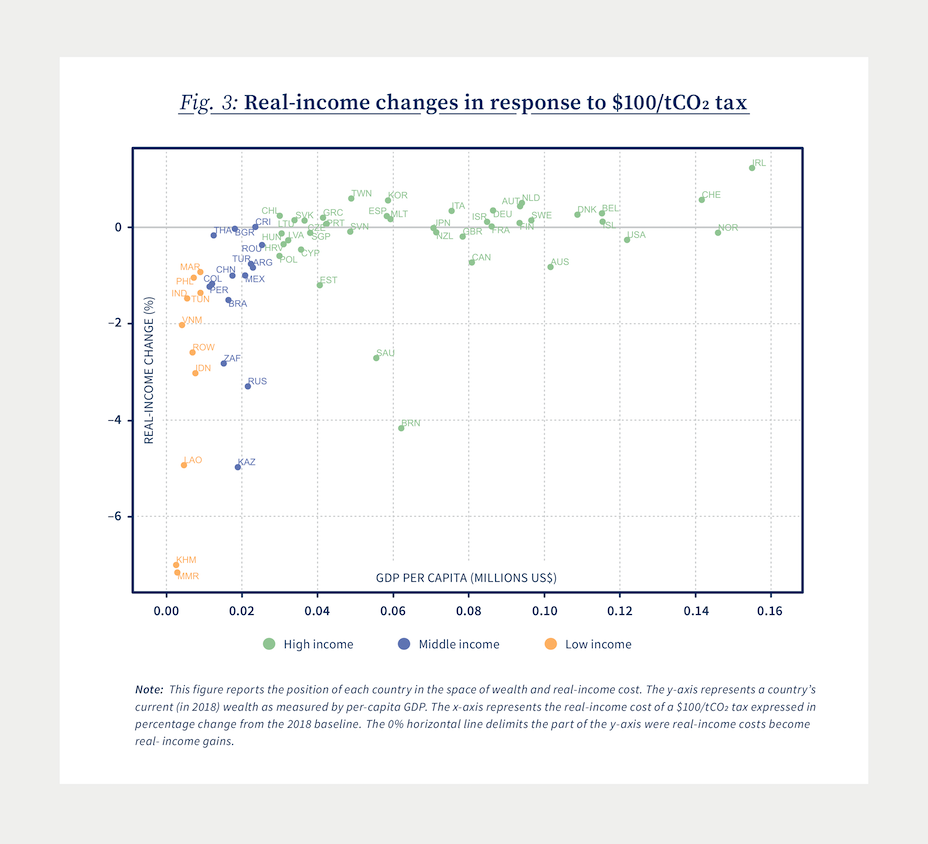
The immediate consequence o f higher effective tax rates are lower levels of real income. Figure 3 plots the change in real income following the implementation of the carbon tax against per-capita GDP.
A dot above the 0 horizontal line is a country whose real income increases in response to the carbon tax, whereas a country below that line will experience a net real-income decrease. The distribution of countries around this line illustrates quite clearly the socio-economic inequalities arising when implementing a global uniform price on the ton of carbon: there is a significant negative relationship between per-capita GDP and real-income cost. In other words, poorer countries experience larger negative economic losses from adjusting to the tax, whereas high-income countries have almost no change in real income or even real income gains (e.g. Ireland, South Korea or Italy all stand above the no-real-income-change line).
Focusing on region-specific dynamics, we can see that Africa, South America and to some extent Asia are very clearly concentrated in the bottom left of the plot that represents poor countries with large negative real-income adjustments. Interestingly, even within the richer regions that are Europe and North America, further analysis reveals that this negative correlation between wealth and real-income adjustment exists regionally.
To explain this effect, the comparison across countries with different levels of development reveals two important facts: (i) countries with lower levels of development tend to be technologically browner and emit more in any given production sector per dollar produced, and (ii) countries with lower levels of development tend to specialize in a substantially browner mix of sectors.4 More specifically, poorer countries are often more upstream in international value chains, providing raw materials that are notably more carbon-intensive than other sectors. Because domestic production often represents a very large fraction of domestic expenditure, this is also reflected in poor countriesʼ consumption baskets.
To our first point, by making production and consumption relatively more expensive in poor countries with currently large emissions, the carbon tax will induce a reallocation of global output away from developing countries towards greener developed countries. In response to a $100/tCO2 global and uniform carbon tax, real gross output is declining in all countries, for an aggregate decline of 2.6%, but with large variations across countries. The largest output declines are concentrated on Southeast Asian countries (e.g., –16.3% for Myanmar, –9.2% for China, –9.1% for India) or in the economic South (e.g., –10.4% for South Africa, –7.9% for Tunisia), while countries in the North and the West see little decline in quantities produced (e.g., –0.6% for Switzerland, –0.9% for France, –1.4% for the U.S.). These net changes positively correlate with the overall carbon intensity of the countries: Myanmar ranks amongst the brownest countries in the world whereas Switzerland amongst the greenest.
The overall impact on a countryʼs output of the carbon tax goes beyond the net decline of production. To our second point, by also making browner sectors of production relatively more expensive than green ones, the carbon tax also induces a reallocation of domestic production away from brown sectors towards green ones, both internationally across countries, and domestically within a given country.
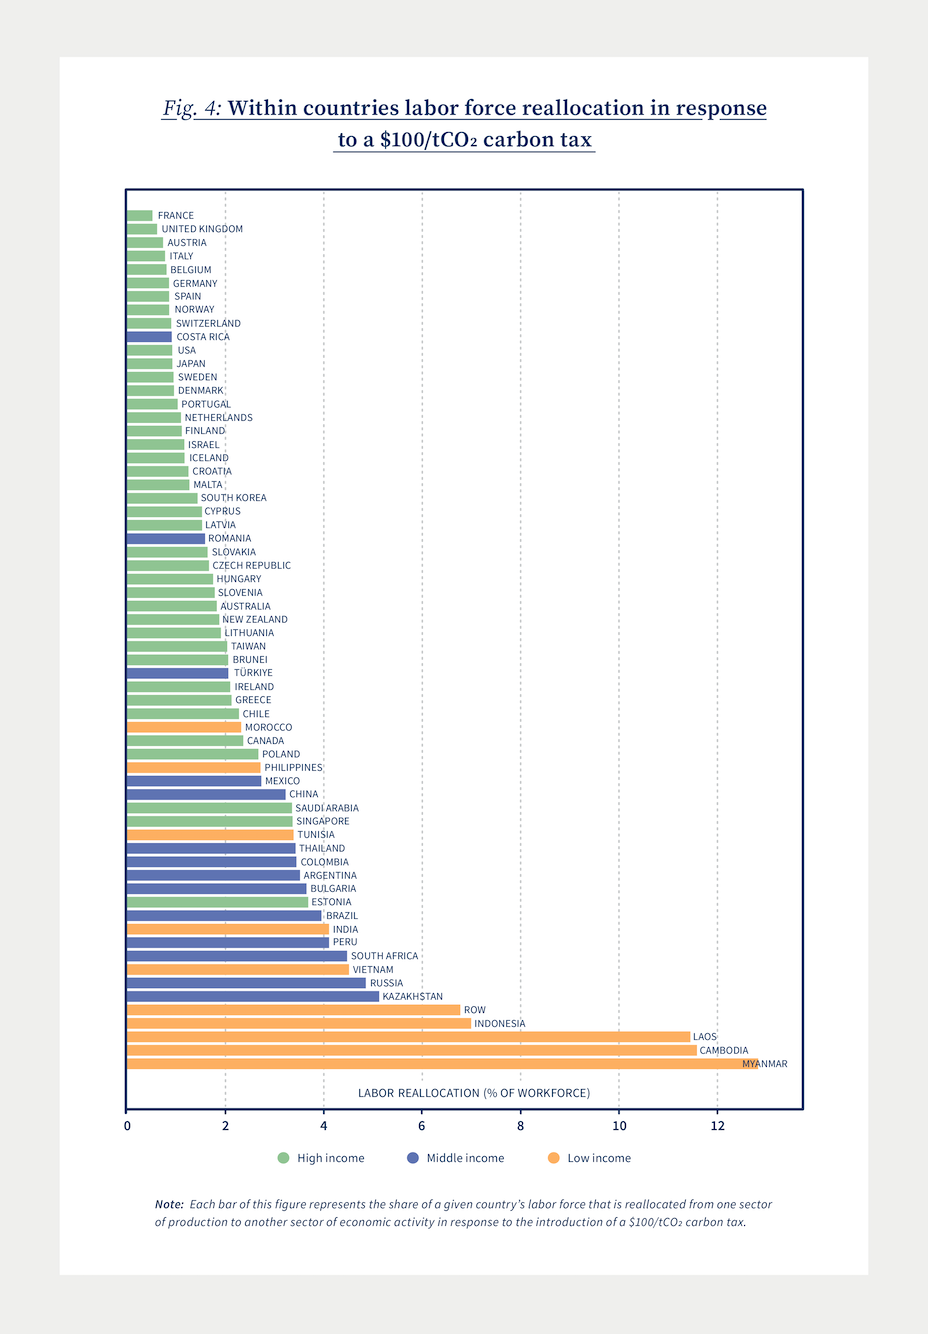
As suggested by Figure 4, this effect is particularly severe on poor countries with a relatively browner sectoral composition of production. Each bar represents the share of each countryʼs labor force that has to move from one sector of production to another one domestically. In other words, it represents the amount of workers that are forced to change their economic activity within a country.5 While being simplistic by construction, such a metric hints at the potential costs in terms of human capital and possible unemployment that the carbon tax could impose within countries, and represents the potentially large disruptions in the internal fabric of a country.
The figure clearly shows that the richest countries (EU members, USA, Japan, South Korea) experience very little disruptions in terms of workforce reallocation: less than 1% of their population is reallocated to a different sector. On the other hand, BRICS experience labor force adjustments in the range of 4 to 8% of national population. As the colors in the plot reveal, the low-income countries are by far the most affected.
To summarize, the economic costs of the optimal climate policy, a global and uniform tax on carbon emissions, are disproportionately borne by poorer countries – be it in terms of the effective tax paid, the real-income response to the tax or the domestic disruptions. In the context of our quantitative analysis, it therefore appears relevant to consider possible applications of the principle of Common but Differentiated Responsibilities.
Realistic cross-country transfers can remedy the socio-economic inequalities induced by climate action but require higher climate pledge
At the 15th Conference of Parties (COP15) of the UNFCCC in Copenhagen in 2009, developed countries committed to a collective goal of mobilizing $100 billion per year by 2020 for climate action in developing countries, in the context of meaningful mitigation actions and transparency on implementation. The goal was formalized at the COP16 in Cancun, and at the COP21 in Paris, it was reiterated and extended to 2025.
According to the latest monitoring report of the OECD, a total of USD 83.3 billion in climate finance was provided and mobilized by developed countries in 2020, falling short of the pledged amount.6 The failure to operationalize the principle of Common but Differentiated Responsibilities, and doubts about the effectiveness of transfers in the absence of market-based incentives have been proposed as arguments for the lack of stronger engagement from developed countries.
In the context of our quantitative analysis, we therefore explore what transfers would be needed in a world where a global and uniform carbon tax is adopted, in order to balance the socio-economic cost of the tax. We propose two scenarios: (i) one where the goal is to equalize real-income changes in response to the carbon tax for all countries – we call it the equal-costs scenario – and (ii) one where countries with the largest responsibility in cumulative global carbon emissions pay the largest economic costs – we call it the polluterpays scenario. Our first scenario would thus be a simple benchmark for perfect equality in climate action, whereas our second scenario aims at applying the CBDR principle. Note that the use of a global and uniform carbon tax as optimal policy tool is not put in question here. As a result, these scenarios should be perceived as benchmarks for perhaps more realistic policies.
Equality in front of climate action can be attained with modest per-capita transfers
Our equal-costs scenario focuses on attaining equality in response to a global carbon tax by designing monetary transfers such that the country-level impact of the tax in terms of real-income change is the same for everyone. Note that this scenario does not implement the CBDR principle, as it does not account for differentiated responsibilities. It only ensures that at minima poor countries do not bear the bulk of the economic costs.
Quantitatively it is striking to note that the overall impact of the global common carbon tax paired with monetary transfers is de facto smoother than without transfers: the reduction of global emissions achieved is the same (–27.5%) for identical aggregated realincome costs (–0.7%). In addition, the gross-output decline is lower (–2.1% compared with –2.6% previously).
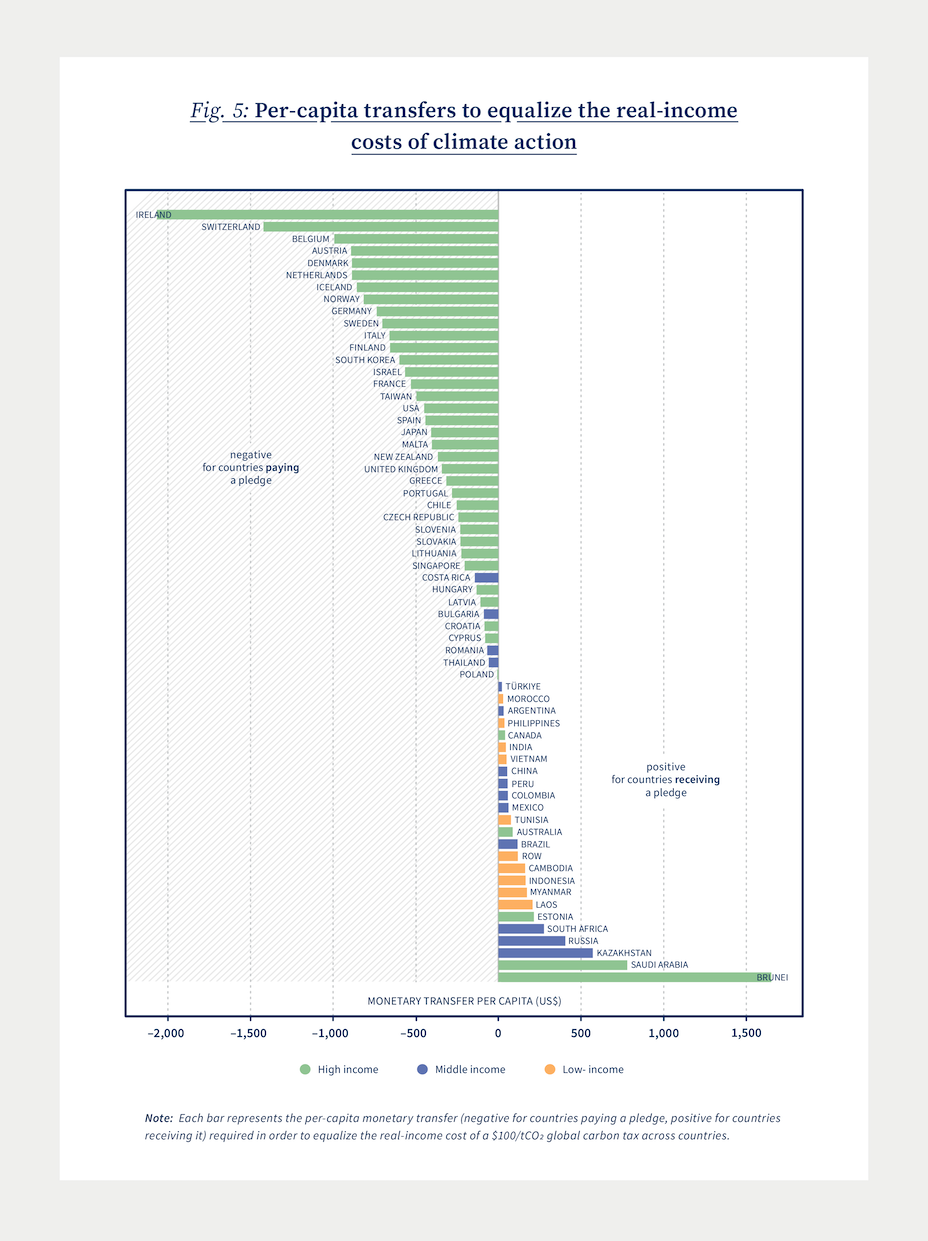
Figure 5 illustrates how the equal-costs transfers are distributed across countries.
With the exception of the two outliers that are Bahrain and Saudi Arabia, the figure reveals that developed countries have to pay a monetary transfer to developing countries in order to equalize the economic cost of a global carbon tax: the largest payers are European countries and the U.S., while the largest receivers are Russia, South Africa and Southeast Asian countries.7
In the comparison with the “USD 100 billion per year” pledge of the successive COPs, our model suggests that in the presence of a global carbon tax, the transfers needed to equalize the economic costs of climate action across countries amount to USD 272 billion. While this is substantially larger than the latest pledge achieved (by a factor 3), the impact this would have on the population of developed countries is in fact relatively modest. The highest transfers need to be paid by Ireland in the amount of $2,000 per person per year, and by Switzerland in the range of $1,400 per person per year. For the rest of the EU members and the U.S., the effective amount that should be paid by an individual in a year does not exceed $1,000. Note that because poor countries tend to have larger populations, the effective transfers received per capita are lower (e.g., $600 per capita for Kazakhstan, less than $200 for Laos and Indonesia).
The equal-costs scenario therefore suggests that in absence of any geopolitical consideration, socio-economic equality in the face of optimal climate action can be achieved with modest transfers.
A polluter-pays transfer scenario is less costly and just as effective in balancing the economic costs of climate action as a fair tax
The tone generally set in the 2022 Conference of Parties of the UNFCCC (COP27) suggests that simple fairness in the distribution of the economic costs of climate action is politically not enough. While 30 years old, the principle of Common but Differentiated Responsibilities has only recently been brought back as leading principle of climate action, in particular in the Paris Agreements. Our polluter-pays scenario aims at quantitatively simulating it.
The “common” part of CBDR is still achieved through the implementation of a global and uniform carbon tax. Note that while imposing that the cost of carbon remains the same “wherever, whenever and however it is emitted”, it also ensures that market-based incentives are preserved through an adjustment of r elative p rice signals. The “differentiated” part of CBDR is then achieved in the form of monetary transfers: quantitatively, we calculate transfers such that the realized real-income cost borne by a country is proportional to its historical contribution to global cumulative emissions, as represented in Figure 1. In practice, this means that the economic cost of the global carbon tax for the U.S. needs to be 25% of the aggregate economic costs, the economic cost for China 13%, and the economic cost of Brazil 1% of the aggregate economic cost of the carbon tax.
The economic cost of the global carbon tax for the U.S. needs to be 25% of the aggregate economic costs, for China 13%, and for Brazil 1%.
As for the equal-costs scenario, the overall impact of the polluter-pays scenario is also smoother than climate action without redistribution: the global reduction of emissions remains at –27.5%, the global real-income cost remains at –0.7%, and the decline in gross output remains lower at –2.1%.
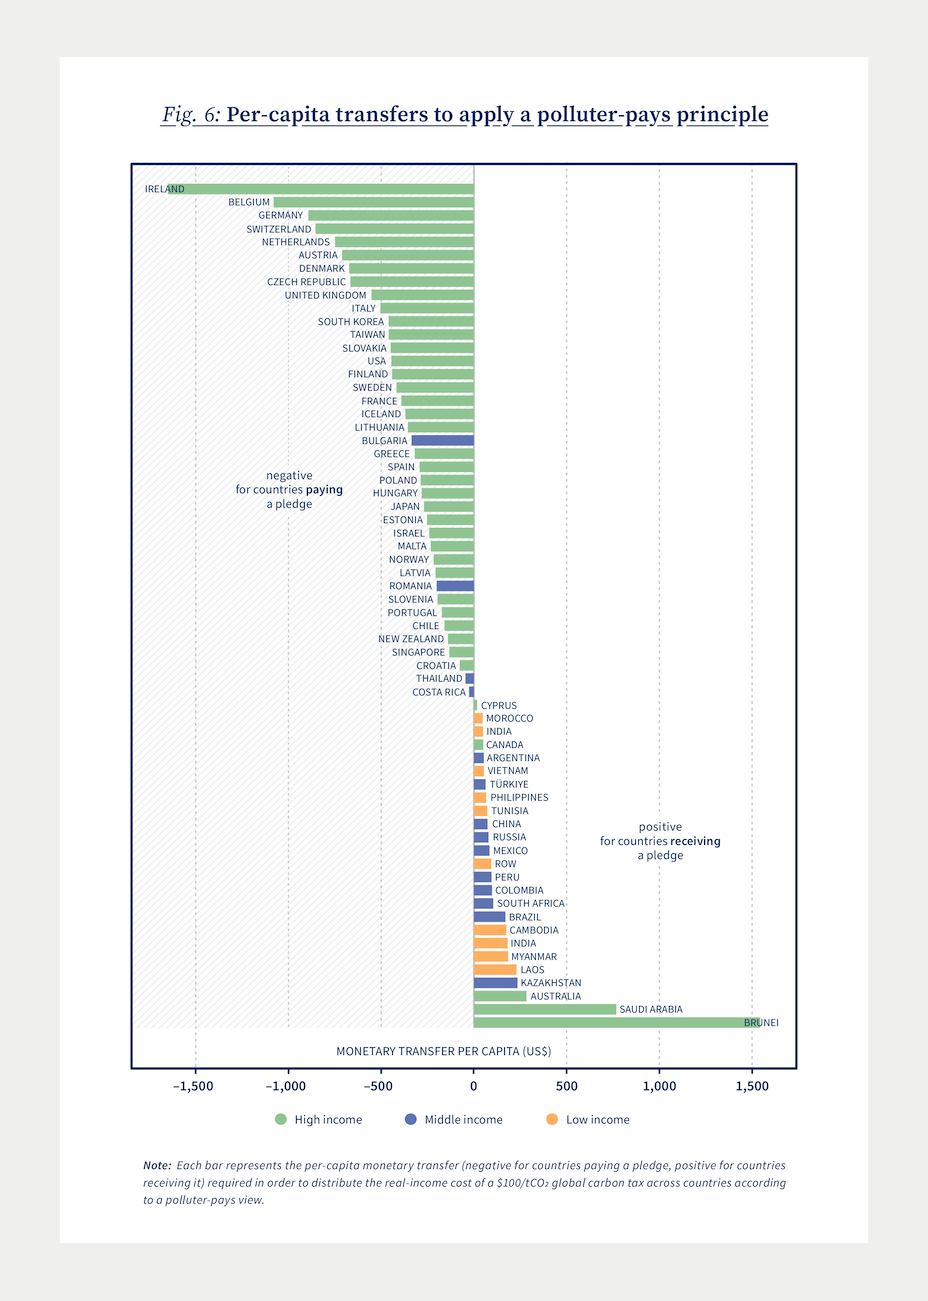
In terms of transfers, three important facts can be emphasized. First, the total amount of transfers required is slightly lower than in the fair-tax scenario at USD 255.7 billion. This is because the equal-costs scenario is focused solely on redistributing economic costs equally, whereas the polluter-pays scenario allows for unequal economic costs based on historical responsibility. As a result, per-capita transfers will also be lower, the maximum amount required being now less than $2,000 per person per year (still paid by Ireland).8
Second, the distribution of transfers across countries still implies that developed countries should pay and developing countries should receive, as is illustrated in Figure 6. There is a clear positive correlation between current per-capita GDP and historical contribution to global cumulative emissions. This shouldnʼt come as a particular surprise as countries that benefited from the Industrial Revolution started to emit CO2 during the 19th century and have now the highest levels of development.
Third, the differences in the distribution of transfers implied by the equal-costs and by the polluter-pays scenarios (comparing Figures 5 and 6) are revealing of countriesʼ current and historical responsibilities in climate change.
Countries that ought to pay a transfer in the equal-costs world remain payers in the polluter-pays scenario, but their relative contributions change, to reflect individual countriesʼ weight in historical emissions. For example, Franceʼs effective transfer per capita is now lower than that of Great Britain, because Franceʼs historical energy sector has focused on carbon-neutral nuclear power, while Great Britainʼs energy mix has been historically borne by coal and later oil and gas.
Similarly, receiving countries in the equal-costs scenario remain so in the polluter-pays scenario, albeit receiving different amounts. This is for example the case of Russia: because Russia is a large producer of natural gas (which belongs in our data to the energy sector, by far the brownest in terms of emission intensity), it is heavily penalized by the carbon tax (see Figure 2, Russia has an effective tax rate of 6% when the global carbon tax is set at $100/tCO2). In the equal-costs scenario, Russia received transfers of the order of $404 per capita, in order to bring its real-income cost to par with other countries. Russia is, however, also a historical polluter so that in the polluter-pays scenario, its effective per-capita transfers are decreased to less than $80 per person per year. The opposite is true of Brazil: currently the third largest exporter of agricultural products globally, Brazilʼs real-income loss in response to a $100/tCO2 without redistribution is relatively high (–1.8%, to be compared to the global cost of –0.7%). In the equal-costs scenario, this implies that Brazil receives per-capita transfers in the order of $115. However, Brazil only recently started to contribute to cumulative emissions (albeit at an accelerating rate, with a current contribution of 1%). This is taken into account in the polluter-pays scenario so that Brazil receives per-capita transfers of the order of $170 in this case.
One constant in the comparison between the two scenarios is that countries that were receivers in the equal-costs scenario remain receivers in the polluter-pays scenario, and payers remain payers. This suggests that a polluter-pays scheme could perhaps be a better redistribution mechanism: fairness is still somewhat achieved, while respecting the politically desired principle of Common but Differentiated Responsibilities.
More broadly, the conclusion of these two quantitative simulations is that achieving efficient but fair climate action is not an unrealistic goal. By combining a market-based common price incentive with differentiated and moderate transfers (on average $200 per person yearly from the North to the South), one can achieve substantial emissions reduction and balance the socio-economic costs of climate action across countries. Considering the failure of differentiated climate pledges in the absence of a common policy applied by all, one can hope that such quantitative study can serve as an inspiring benchmark for policy making.
Achieving efficient but fair climate action is not an unrealistic goal.
Conclusion
In this Kühne Impact Series, we quantify the socio-economic inequalities induced by climate action. We show that the economic cost of a global and uniform carbon tax – the optimal economic policy tool to fight climate change – is disproportionately borne by poor and developing countries. Our quantitative analysis reveals, however, that moderate monetary transfers across countries can remedy this. In particular, an application of the principle of Common but Differentiated Responsibilities through a polluter-pays combination of tax and transfers is just as efficient at reducing emissions and ensures a politically desirable redistribution of the costs of climate action.
- Carbon Pricing of a Climate Coalition. 2016. Jean Tirole. TSE, Institute for Advanced Study in Toulouse.
- Climate Change 2022: Impacts Adaptation and Vulnerability. 2022. IPCC Sixth Assessment Report, Working Group II.
- Who has contributed most to global CO2 emissions? Our world in data: https://ourworldindata.org/contributed-most-global-co2
- For an overview of emission intensity across countries and sectors, see our Kühne Impact Series «Buy Green Not Local: How International Trade Can Help Save Our Planet» (03/2021).
- In our model, one key assumption is that labor is immobile across countries. This means that our quantitative analysis does not allow for economic migration across countries, which may cause our model to overestimate labor disruptions (if economic migration means less internal moves) or underestimate welfare costs (if economic migration is associated with welfare losses in either the sending or the receiving country).
- Aggregate Trends of Climate Finance Provided and Mobilised by Developed Countries in 2013-2020. 2022. OECD
- Bahrain and Saudi Arabia are strong outliers. While being already quite rich, they are heavily penalized by the carbon tax as their main economic activity is oil production (albeit with the greenest emission intensities in the data for the sectors of mining and energy). Since our scenario only cares about making the economic cost of the tax equal across countries, and ignores entirely geopolitical considerations, they become large beneficiaries of such transfers.
- Bahrain and Saudi Arabia remain outliers in this scenario too. This is again because they are disproportionately penalized by the carbon tax relative to their historical contribution to cumulative emissions.


Author
Simon Lepot
Senior Research Fellow at the Kühne Center for Sustainable Trade and Logistics at the University of Zurich
More Issues
Variable Carbon Pricing and the Environmental Gains from Trade
Optimal Carbon Tax for Maritime Shipping?
The Global Diffusion of Clean Technology

The Sustainable Globalization Index

The Green Comparative Advantage:

Global Trade

The EU Emissions Trading System

The Hidden Green Sourcing Potential in European Trade

The European Green Deal

Post-COVID19 resilience

Africa’s Trade Potential

Buy Green not Local

A New Hope for the WTO?

Crumbling Economy, Booming Trade
Pandemic and Trade
The Dynamics of Global Trade in Times of Corona

EU Trade Agreements
Past, present, and future developments